Copyright © 1988 by Annual Reviews. All rights reserved
| Annu. Rev. Astron. Astrophys. 1988. 26:
561-630 Copyright © 1988 by Annual Reviews. All rights reserved |


Due to this circularity of the argument for luminosity evolution, we seek evolutionary tests that are independent of the geometry, i.e. of q0. Currently, such tests are of two kinds. In the first we look for changes in the shape of the spectral energy distribution for "standard" galaxies (i.e. of particular Hubble types) at different redshifts. In the second, differences in the expected morphological mix in particular environments at different redshifts are queried for possible evolutionary information. A comprehensive review is given by Kron (1982).
7.1. Changes in Spectral Energy Distribution With Redshift
7.1.1. BROADBAND COLORS Calculations of time-variable evolution were possible as soon as it was realized that the HR diagram could be explained by evolutionary tracks off the main sequence rather than up it, and especially that the Trumpler (1925) cluster classification was an age sequence (Sandage 1953, 1957, 1958). Empirical evidence for the change of color with time of stellar systems that had coeval star formation was set out from galactic cluster data (Sandage 1963, his Figure 7). The B - V colors of the integrated light from any given cluster was found to correlate well with its age over the age range from 106 to 1010 yr.
The effect was successfully modeled by Searle et al. (1973) in what was one of the first papers on theoretical galaxy evolution, a subject that has developed into the current flood of detailed studies, often reviewed [e.g. IAU Symposia Nos. 79, 92, 104, and 124, and the Erice workshop on galaxies at high redshift (Kron & Renzini 1988)].
A principal result of the early work was to show how very slow the
color evolution is with time for old stellar systems. The "observed"
rte from galactic clusters is
 (B -
V)
/ t
(B -
V)
/ t
 0.03 mag
per 109 yr at age ~ 1010 yr
(Sandage 1963,
his Figure 7). This observational result is the
same as the theoretical calculation given earlier by
Crampin & Hoyle (1961),
who asked what the colors of M67 would be at earlier ages. The
very shallow color dependence with old age is also a characteristic of
all subsequent reasonable galaxy evolution models, no matter what
their level of sophistication (cf.
Quirk & Tinsley 1973,
their Figure 1;
Huchra 1977,
Larson & Tinsley 1978,
their Figure 2;
Bruzual & Kron 1980,
and references therein).
0.03 mag
per 109 yr at age ~ 1010 yr
(Sandage 1963,
his Figure 7). This observational result is the
same as the theoretical calculation given earlier by
Crampin & Hoyle (1961),
who asked what the colors of M67 would be at earlier ages. The
very shallow color dependence with old age is also a characteristic of
all subsequent reasonable galaxy evolution models, no matter what
their level of sophistication (cf.
Quirk & Tinsley 1973,
their Figure 1;
Huchra 1977,
Larson & Tinsley 1978,
their Figure 2;
Bruzual & Kron 1980,
and references therein).
This expected rate of B - V change (in the rest wavelength
frame) with
look-back time can be transformed into a function of z using
Equations
36 and 37, which relate z with the evolutionary time for the special
cases of q0 = 0 and q0 = 1/2. The
age of the q0 = 1/2 model is
13 × 109 yr if H0 = 50. Redshifts of
0.2, 0.5, and 1.0 have look-back times of
3.1 × 10⁹, 5.9 × 10⁹, and
8.4 × 10⁹ yr, respectively, in this case.
Hence, no color evolution larger than
(B -
V) 0.1 mag is
expected for E galaxies until z > 0.2, after which color
effects larger than this should appear.
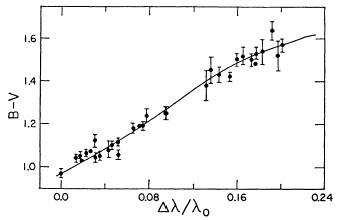
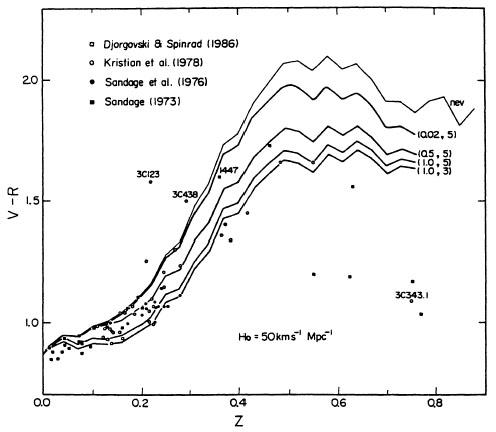
This expectation is confirmed. Figure 9 shows the observed B - V colors of first-ranked E galaxies to redshifts as large as z = 0.2 compared with the predicted color of a standard E galaxy redshifted through the B and V photometric bands. No color evolution has yet occurred. Only after extension to larger redshifts and to the V - R color does some color evolution begin to occur, as expected (Kristian et al. 1978, Djorgovski et al. 1985). The available V - R data are shown in Figure 10. The no-evolution case (the simple K correction applied alone as described in Section 4.2) does not fit the data.
|
Figure 9. Observed and predicted B - V, redshift relation for first-ranked E galaxies (from Oke & Sandage 1968). |
|
Figure 10. Same as Figure 9 for V - R colors. The theoretical curves are for various q0 and redshift formation values using adopted luminosity evolutionary corrections. The upper curve is for no evolution of the spectral energy distribution. Evolution is clearly required by the data at high redshift (from Yoshii & Takahara 1988). |
These first attempts to find color evolution used broadband photometry of first-ranked cluster E galaxies. In the work of Kristian et al. (1978) the cluster sample was taken from the list of classical clusters known to HMS and from the Abell (1958) catalog, to which they added their sample of large-redshift clusters (z ~ 0.2 - 0.7) found in a special search using IIIaJ photography with the Palomar 48-inch Schmidt telescope (unpublished). A deeper special search by Gunn et al. (1986) lists the most distant cluster candidates yet known, found in a similar survey employing both the Schmidt and the 200-inch Hale reflector.
From an intensive study of Kron's distant cluster CL 0016+16 (z = 0.54), Koo (1981) used UBVI broadband photometry to demonstrate the existence of many red galaxies that have the nearly normal colors of nearby E/S0 galaxies, redshifted without appreciable color evolution. Koo cited the results as a counterexample of the Butcher-Oemler effect (Section 7.2.1). However, he later joined with Ellis et al. (1985) to show from intermediate-band six-color photometry that the mean energy distribution of the E/S0 candidates in this cluster was "significantly bluer than the present day equivalent (galaxies) at ultraviolet wavelengths," and therefore that passive evolution of the spectral energy distribution probably had occurred over this look-back time.
However, the effects are small. Contradictory evidence in the field (Koo & Kron 1988a, b) and in other clusters suggests that the rate of evolution may not be the same in all E/S0 galaxies in all environments at any given redshift (Ellis 1988). If so, the evolutionary term E(t) in Equation 35 would not be a unique function of look-back time, even for any given Hubble type. This evolutionary correction to the m(z) Hubble diagram would then be a stochastic variable, and the hope to find q0 by this direct route would again recede as it has so often before.
7.1.2. DETAILED SPECTRAL ENERGY DISTRIBUTIONS
Broadband colors disadvantageously integrate over important details
of the spectra that should betray any evolution more sensitively.
Oke (1971)
obtained spectra of three moderately high-redshift galaxies
(z = 0.20, 0.38, 0.46) and found no evidence for evolution in the
green and red, but he had no fiducial spectrum in the UV with which to
compare over this more sensitive region.
Wilkinson & Oke (1978)
extended the sample to 56 galaxies and again found no effect larger than
(B -
V) = 0.04 mag (if that) to the look-back time corresponding
to z = 0.46. They attributed their failure to detect even a small
expected effect to variations in the intrinsic properties of the
sample galaxies - they are not all perfect templates of an ideal
standard.
The large sample size of the Wilkerson-Oke study gives considerable weight to their conclusions. However, there are hints of evolution in the SEDs of specially selected samples. Spinrad (1986, his Figures 12 and 13) shows that the mean SED of two giant E galaxies at z = 0.2 is redder than Schild & Oke's (1971) standard SED for first-ranked E galaxies. He also finds that the mean spectra of three giant E's at z = 0.75 is substantially bluer in the more sensitive ultraviolet than is the standard. But again, contradictory evidence in field galaxy samples [see Koo (1988b) for a review] is that little or no color evolution exists in average samples to z ~ 0.4. However, evidence discussed in the next two sections suggests that the presence or absence of evolution may depend on the nature of the sample, and that the effects (if present) are likely to be hidden among stronger selection biases.
7.1.3. THE 4000-Å BREAK
Bruzual (1983a,
his Figure 4), following
Spinrad (1977,
1980),
presented observational evidence and theoretical models of the change
in the 4000-Å spectral discontinuity with time for different star
formation rates. The size of this spectral "break" is a moderately
sensitive function of the spectral type of the main sequence
termination point
(Bruzual 1983a,
his Figure 3;
Hamilton 1985,
his Figure 6). It is also known to be sensitive to metallicity at a given
temperature, being the chief blanketing index for the UV excess given
by  (U - B)
(or m1) that measures [Fe/H] for F and G subdwarfs
(Roman 1954,
Sandage & Eggen 1959,
Stromgren 1966).
For these two
reasons (age and metallicity) the break strength is expected to change with
look-back time in some models of evolution of standard galaxies of a
given Hubble type.
(U - B)
(or m1) that measures [Fe/H] for F and G subdwarfs
(Roman 1954,
Sandage & Eggen 1959,
Stromgren 1966).
For these two
reasons (age and metallicity) the break strength is expected to change with
look-back time in some models of evolution of standard galaxies of a
given Hubble type.
Spinrad's (1986, his Figure 15) data show a pronounced change of break strength with redshift for E galaxies in clusters chosen without regard to galaxy color, i.e. simply an "average" galaxy, wherever it could be found. The break change with z observed by Spinrad agrees well with one of the calculated models by Bruzual.
However, in a remarkable development, Hamilton (1985) applied a rigid color selection criterion for a galaxy sample that he used to study the redshift dependence of the break amplitude. In a massive four-color survey that covered 4 square degrees, composed of eight high-latitude fields, Hamilton picked the reddest galaxies in the sample, using color-color plots. There was no appeal in the selection to cluster membership because the selection criterion was blind to any fact but reddest color. The redshift range of Hamilton's sample was z = 0 - 0.8. No change of break amplitude was detected at least to z = 0.6, in contrast to Spinrad's result for his more "average" sample.
Hamilton's result shows that very old galaxies exist at z = 0.8 that
are at least 2 × 10⁹ yr older than the look-back time of
 = 8.7 × 10⁹
yr (if H0 = 50, q0 = 0). He finds no
evidence for either recent star
formation or for passive evolution of the stellar content of this
sample. Hamilton's observed lack of passive evolution is consistent
with his models, but it is not in agreement with the models of
Bruzual. The data prove that at least some normal, non-starbursting E
galaxies exist at large redshift, and that they are old.
= 8.7 × 10⁹
yr (if H0 = 50, q0 = 0). He finds no
evidence for either recent star
formation or for passive evolution of the stellar content of this
sample. Hamilton's observed lack of passive evolution is consistent
with his models, but it is not in agreement with the models of
Bruzual. The data prove that at least some normal, non-starbursting E
galaxies exist at large redshift, and that they are old.
Does Spinrad's result require evolution for his sample? There is no proof in Spinrad's data that his sample is composed of normal ellipticals, rather than Sa, Sb, or Sc galaxies. It is known that these later types have systematically smaller breaks in local galaxies than in local ellipticals [Hamilton 1985, his Table 2 (from the data of Heckman et al. 1980)]. Spinrad's sample of not necessarily first-ranked cluster galaxies may contain these later types. The same reason of mixed morphology might explain the larger dispersion in break amplitude at a given absolute magnitude that was found by Dressler & Shectman (1987) in galaxies in moderately distant clusters but not by Kimble et al. (1987) in local E and S0 galaxies in the Virgo cluster.
The conclusion is that secular spectral evolution in the look-back time to z = 0.8 has not been shown, beyond doubt, from the break data. As with the broadband data the results are, as yet, marginal, but the potential of the method is great.