Copyright © 1997 by Annual Reviews. All rights reserved
| Annu. Rev. Astron. Astrophys. 1997. 35:
445-502 Copyright © 1997 by Annual Reviews. All rights reserved |


7.3. Intensive Multiwavelength Campaigns
Most blazars vary substantially on very short time scales (hours to days), at least from the optical through the gamma-ray band. Therefore increasing efforts have been devoted to frequent, and when possible continuous, observations at many wavelengths. This has been possible only for very few objects.
The best candidates for UV-X-ray monitoring are the BL Lac objects PKS 2155-304 and Mrk 421 (HBL). Both can be sampled with ~ 1-h resolution due to their brightness at those wavelengths. Mrk 421 can also be monitored with daily sampling at TeV energies. In contrast, 3C 279, a highly luminous quasar with an LBL-like continuum, is too faint to monitor rapidly at UV wavelengths but is the brightest blazar at GeV energies and has a long history of multiwavelength observations. Finally, the LBL PKS 0716+71 is a well-monitored intraday variable source. These four blazars, the targets of the most extensive multiwavelength monitoring, are discussed in turn below.
PKS 2155-304 The first intensive campaign on PKS 2155-304 (November 1991), with ~ 5 days of quasicontinuous coverage with IUE and ~ 3.5 days with ROSAT, yielded a number of unprecedented results (Smith et al 1992, Urry et al 1993, Brinkmann et al 1994, Courvoisier et al 1995, Edelson et al 1995). Variations at optical, UV, and X-ray wavelengths were extremely rapid. The fastest variations observed had ~ 10-30% changes over several hours, and the autocorrelation function of these fluctuations had a peak at ~ 0.7 days. Optical, UV, and X-ray light curves were closely correlated and the amplitude of variation was essentially independent of wavelength, ruling out an accretion disk origin of the UV continuum (as did also the polarization characteristics). The X-rays led the UV by a small but significant amount, roughly 2-3 h. Over the full month, the UV intensity changed by a factor of 2, as seen in the optical/IR light curves.
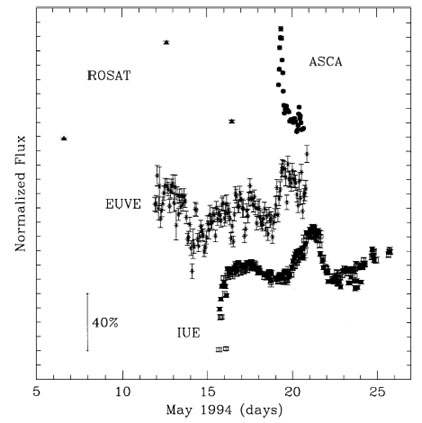
A second, longer campaign (May 1994) - with ~ 10 days of IUE, ~ 9 days of EUVE, 2 days of ASCA, and 3 short ROSAT observations - showed at least one prominent isolated flare rather than the "quasiperiodic" low amplitude variations seen in the first campaign. The light curves from this second campaign are shown in Figure 8 (Kii et al 1997, Pesce et al 1997, Pian et al 1997, Urry et al 1997; HL Marshall and collaborators, in preparation).
|
Figure 8. Normalized X-ray, EUV, and UV light curves of PKS 2155-304 from the second intensive multiwavelength monitoring campaign, in May 1994. The ASCA data show a strong flare, echoed one day later by EUVE and two days later with IUE. The amplitude of the flares decreases and the duration increases with increasing wavelength. [From Urry et al (1997).] |
The overall variability amplitude was much higher than in the first epoch, particularly in the X-ray band, where the flux rose and fell by a factor of ~ 2.5 in about a day. The variability was strongly wavelength dependent: The central UV flare, which can most plausibly be identified with the strong X-ray flare, has an amplitude of ~ 35%, a factor of ~ 5 smaller than the X-ray flare. (Note however that the wavelength range covered by ROSAT is closer to that of EUVE than to ASCA, and the EUVE variations were only slightly larger than the IUE ones.) The X-ray flare appears to lead the EUV and UV fluxes by 1 and 2 days, respectively, an order of magnitude longer than the lag detected in the first epoch. Within the ASCA data, the 0.5- to 1-keV photons lagged the 2.2- to 10-keV photons by 1.5 h (Makino et al 1996).
Despite the differences, these two campaigns give the first direct evidence that the variations from 10 keV to 5 eV are correlated on short time scales and that high frequencies lead the lower ones.
MRK 421 The extraordinary high-energy spectrum of Mrk 421 motivated repeated campaigns of simultaneous observations with ASCA, CGRO, and the Whipple Telescope in May 1994 and in May 1995. In both cases, large variations of TeV and X-ray fluxes were observed. The 1995 campaign had better sampling in the TeV range and quasicontinuous coverage with EUVE. The spectral snapshots shown in Figure 7 derive from the 1994 data, and the 1995 light curves obtained with Whipple, ASCA, EUVE, and a ground-based optical telescope are shown in Figure 9 (Buckley et al 1996).

|
FIgure 9. TeV, X-ray, and optical light curves of Mrk 421 from April-May 1995. The largest amplitude variability is at TeV and X-ray energies; the optical amplitude is much smaller, but the optical light curve is well correlated with TeV light curve. [From Buckley et al (1996).] |
The X-ray and TeV light curves are highly correlated with no apparent lag, while the EUVE and optical light curves lag the TeV (and likely the X-ray) maximum by about a day. This behavior is very reminiscent of the PKS 2155-304 flare, at least in the spectral bands that were covered in both objects. (Unfortunately the southern declination of PKS 2155-304 has prevented observations in the TeV range up to now.) Moreover, as for PKS 2155-304, the 0.5- to 1-keV photons are found to lag the 2- to 7.5-keV photons by about 1 h (Takahashi et al 1996).
3C 279 3C 279 was the first blazar discovered to emit strong and variable GeV gamma rays, by EGRET in June 1991. A two-week multiwavelength monitoring campaign followed in December 1992-January 1993. Because 3C 279 was then at a very low intensity level, the scheduled daily sampling could not be performed with IUE and the gamma-ray observations yielded only an average flux; however, several simultaneous gamma-ray, X-ray, UV, optical (BVRI), millimeter, and radio observations were obtained, yielding a well-measured spectral energy distribution of 3C 279 in the low state. Compared to the high state in June 1991, the low-state spectrum decreased dramatically and in a highly correlated fashion at frequencies above 1014 Hz (Maraschi et al 1994). The variability amplitude increased with frequency from the IR to the UV band, with a steeper spectral shape in the low state. Regarding the second spectral component, the variability amplitude was rather small at the lowest X-ray energies but increased with increasing frequency and was largest in gamma rays.
The optical monitoring during the 1992-1993 campaign evidenced large amplitude variability, almost a factor of 2 in 10 days (Grandi et al 1996), while at the same time the X-ray flux measured with ROSAT varied by less than 20%. This shows that the optical and X-ray emissions were not well correlated on short time scales.
In January 1996, intense gamma-ray flaring in 3C 279 was discovered and followed with multiwavelength coverage. These new data will yield information about the multiwavelength correlations on short time scales in this and, by extension, other LBL. Simultaneous observations with the Infrared Space Observatory (ISO) should determine the position of the synchrotron peak, which from ground-based data can only be constrained to lie between 1012-1014 Hz.
S5 0716+71 After the discovery of intraday variability in S5 0716+71 (see Wagner & Witzel 1995), this BL Lac object was followed intensively at radio and optical wavelengths. IUE and X-ray variations were also seen but with sparser sampling (Wagner et al 1996). There is a definite trend for bluer colors during short flares, whereas the long-term variations occur at constant color (Ghisellini et al 1997). The spectrum in the radio band flattens when the optical flux brightens, indicating that the flaring component is self-absorbed. The UV and X-ray fluxes both seem to vary with the optical flux on short time scales (hours), but the optical to X-ray ratio is not constant from day to day.
The gamma-ray emission from S5 0716+71 is rather weak and shows a relatively flat spectrum, and it varies by factors of ~ 2 over year-long time scales (Lin et al 1995). The broadband spectral properties of this object suggest that it is intermediate between LBL and HBL.