


When possible, ultraviolet diagnostic tools should be avoided because
of their sensitivity to dust extinctions (see the Tenth Commandment
and Table 1). However,
investigators of the high-redshift universe
often have very little choice but to study this region of the
electromagnetic spectrum. The ultraviolet domain is potentially a
rich source of diagnostic lines. The main emission lines are listed
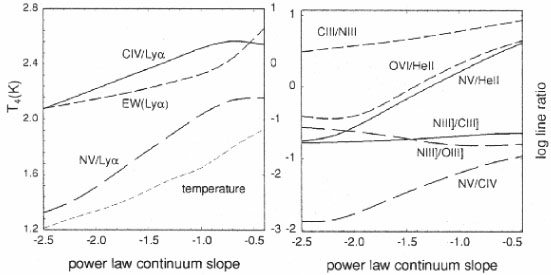
in Table 2. Among the most useful diagnostics to
discriminate between AGNs and starbursts are the N V
 1240 / He II
4686, N V
1240 /
C IV 1549,
N V 1240 /
Ly
1240 / He II
4686, N V
1240 /
C IV 1549,
N V 1240 /
Ly , and
C IV 1549 /
Ly emission-line
ratios. As shown in Figure 1, these ratios are
sensitive functions of the shape of the ionizing
continuum (harder spectra provide more heating per photoionization,
therefore increasing the temperature). These line ratios have been
used extensively in studies of high-z quasars (e.g.,
Hamann & Ferland
1999)
and radio galaxies (e.g.,
Röttgering et
al. 1997;
Villar-Martin et
al. 1996,
1999),
and the analysis of low-z AGNs/LINERs (e.g.,
Ho et al. 1996;
Barth et al. 1996,
1997;
Maoz et al. 1998;
Nicholson et al. 1998)
and starburst galaxies (e.g.,
Robert, Leitherer, &
Heckman 1993).
, and
C IV 1549 /
Ly emission-line
ratios. As shown in Figure 1, these ratios are
sensitive functions of the shape of the ionizing
continuum (harder spectra provide more heating per photoionization,
therefore increasing the temperature). These line ratios have been
used extensively in studies of high-z quasars (e.g.,
Hamann & Ferland
1999)
and radio galaxies (e.g.,
Röttgering et
al. 1997;
Villar-Martin et
al. 1996,
1999),
and the analysis of low-z AGNs/LINERs (e.g.,
Ho et al. 1996;
Barth et al. 1996,
1997;
Maoz et al. 1998;
Nicholson et al. 1998)
and starburst galaxies (e.g.,
Robert, Leitherer, &
Heckman 1993).
| Low-to-Moderate Ionization Lines | High-Ionization Lines | ||
| Line |  (eV) (eV)
| Line | (eV)
|
| C III 977 Å | 24.4 | O VI 1032, 1038 Å | 114 |
| N III 991, 1750 Å | 29.6 | N V 1240 Å | 77.4 |
Ly 1026
Å, Ly 1216 Å 1026
Å, Ly 1216 Å
| 13.6 | O IV] 1407 Å | 54.9 |
| Si IV 1394, 1403 Å | 33.5 | N IV] 1488 Å | 47.4 |
| O III] 1663 Å | 35.1 | C IV 1549 Å | 47.9 |
| N III] 1750 Å | 29.6 | He II 1085, 1640 Å | 54.4 |
| Si III 1895 Å | 16.3 | ||
| C III] 1909 Å | 24.4 | ||
| Fe II 2080, 2500, 3300 Å | 7.9 | ||
| [O III] 2322 Å | 35.1 | ||
| C II] 2326 Å | 11.3 | ||
| Si II 2336 Å | 8.2 | ||
| Mg II 2798 Å | 7.6 | ||
|
Figure 1. Predicted UV line flux ratios,
gas temperatures, and dimensionless equivalent widths in
Ly |

 - 1.5. From