


The excellent quantum efficiency of current CCDs combined with the
high transparency and low emissivity of the Earth's atmosphere at
optical wavelengths make optical spectroscopy the easiest way to
identify AGNs. Table 3 lists the strongest
diagnostic lines between 3000 Å and 1
µm. Classification schemes involving several line
ratios which take full advantage of the physical distinction between
the two types of objects and minimize the effects of reddening
correction and errors in the flux calibration have proven very useful
for the identification of galaxies as AGNs or starbursts (e.g.,
Phillips, Baldwin, &
Terlevich 1981;
Veilleux &
Osterbrock 1987;
Osterbrock, Tran, &
Veilleux 1992;
Dopita et al. 2000).
Examples of
emission-line diagrams are shown in Figure 2 for
ultraluminous
infrared galaxies from the 1-Jy sample (ULIGs; these are IRAS galaxies
with infrared luminosities between 8 and 1000 µm larger than or
equal to 1012
L ;
Kim 1995).
The results from this classification
indicates that the fraction of Seyfert nuclei increases from ~
5% at log[LIR /
L] = 10 - 11,
to ~ 50% at log[LIR /
L] > 12.3
(Veilleux et al. 1995,
Kim, Veilleux, &
Sanders 1998;
Veilleux, Kim, &
Sanders 1999a).
;
Kim 1995).
The results from this classification
indicates that the fraction of Seyfert nuclei increases from ~
5% at log[LIR /
L] = 10 - 11,
to ~ 50% at log[LIR /
L] > 12.3
(Veilleux et al. 1995,
Kim, Veilleux, &
Sanders 1998;
Veilleux, Kim, &
Sanders 1999a).
| Low-to-Moderate Ionization Lines | High-Ionization Lines | ||
| Line |  (eV) (eV)
| Line | (eV)
|
| [O II] 3727, 7325 Å | 13.6 | [Ne V] 3346, 3426 Å | 97.1 |
| [Ne III] 3869, 3968 Å | 41.0 | [Fe V] 3840, 3893, 4071 Å | 54.8 |
| [O III] 4363, 5007 Å | 35.1 | [Fe VII] 3588, 3760, 4071, 5721, 6087 Å | 99.0 |
| Fe II 4500, 5190, 5300 Å | 7.9 | He II 4686 Å | 54.4 |
H 4861 Å,
H 4861 Å,
H 6563 Å 6563 Å
| 13.6 | [Fe XIV] 5303 Å | 344 |
| He I 5876, 7065 Å | 24.6 | [Fe X] 6375 Å | 235 |
| [O I] 6300, 6363 Å | 0.0 | [Fe XI] 7892 Å | 262 |
| [N II] 5755, 6548, 6583 Å | 14.5 | ||
| [S II] 6716, 6731 Å | 10.4 | ||
| [S III] 6312, 9069, 9531 Å | 23.3 | ||
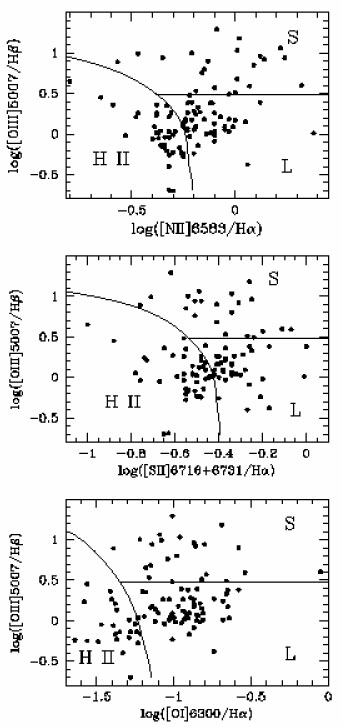
|
Figure 2. Examples of optical line ratio diagrams used for the classification of ultraluminous infrared galaxies. From Veilleux et al. (1999a). |