


The mid-to-far infrared region has long been known to be a rich source of emission-line diagnostics in active and starburst galaxies (e.g., Watson et al. 1984; Roche et al. 1984; Aitken & Roche 1985; Crawford et al. 1985; Lugten et al. 1986; Duffy et al. 1987; Roche et al. 1984, 1991, Spinoglio & Malkan 1992; Voit 1992). With the Infrared Space Observatory (ISO) much progress has been made in this area of research in recent years (see review by Genzel & Cesarsky 2000). One of the most important applications of ISO spectroscopy has been its use as a tool to distinguish between star formation and AGN activity in obscured environments. High ionization fine structure lines are strong in the NLR of AGNs but very weak in starbursts (Table 5). Fine-structure lines have smaller excitation energies than their optical counterparts, so they are less temperature sensitive and less model dependent. Unfortunately, they are also fainter than their optical counterparts, and are therefore difficult to detect even in genuine, optically-selected AGNs (e.g., Genzel et al. 1998).
| Line |  (eV) (eV)
|
| [Ar III] 9 µm | 27.6 |
| [S IV] 10.5 µm | 34.8 |
| [Ne II] 12.8 µm | 21.6 |
| [Ne V] 14.3, 24.2 µm | 97.1 |
| [Ne III] 15.6, 36.0 µm | 41.0 |
| [S III] 18, 34 µm | 23.3 |
| [O IV] 26 µm | 54.9 |
| [Si II] 35 µm | 8.2 |
| [O III] 52, 88 µm | 35.1 |
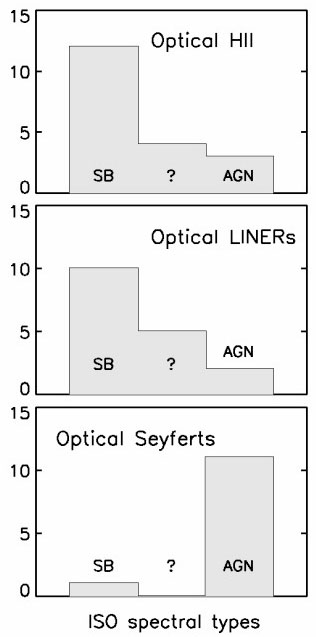
This work has since been extended to larger samples, using the polycyclic aromatic hydrocarbon (PAH) diagnostic to reach fainter sources (e.g., Lutz et al. 1998; Rigopoulou et al. 1999; Tran et al. 2001). The PAH features at 3.3, 6.2, 7.7, 8.7, and 11.2 µm are ubiquitous in normal galaxies and starbursts but absent near an AGN (e.g., Roche et al. 1991). Obscured regions also show absorption features, the strongest ones at 9.7 and 18 µm being due to silicate dust, which complicate the placement of the continuum near the PAH features. An object-by-object comparison of the optical and ISO spectral types for ULIGs in the 1-Jy sample reveals a remarkably good agreement between the two classification schemes if optically classified LINERs are assigned to the starburst group (Fig. 4). These results indicate that strong AGN activity, once triggered, quickly breaks the obscuring screen at least in certain directions, thus becoming detectable over a wide wavelength range.
|
Figure 4. Optical versus mid-infrared classification of ultraluminous infrared galaxies. From Lutz, Veilleux, & Genzel (1999). |