


Infrared-bright galaxies such as those discussed in the previous section are hosts to large quantities of molecular gas and dust (e.g., Solomon et al. 1997). The optical line ratios measured in these objects are undoubtedly affected by dust extinction. It is therefore important to also observe these objects at longer wavelengths to verify the results derived from the optical spectra. Near-infrared spectroscopy has had success finding obscured BLRs in several ULIGs (e.g., Hines 1991; Veilleux et al. 1997b, 1999b; spectropolarimetry has lent support to some of these findings: Hines 1991; Hough et al. 1991; Hines & Wills 1993; Hines et al. 1995; Young et al. 1993). This technique has also proven useful in the study of highly reddened BLRs in intermediate Seyferts (1.8's and 1.9's; Goodrich 1990; Rix et al. 1990) and in optically classified Seyfert 2 and radio galaxies (e.g., Blanco, Ward, & Wright 1990; Goodrich, Veilleux, & Hill 1994; Ruiz, Rieke, & Schmidt 1994; Hill, Goodrich, DePoy 1996; Veilleux, Goodrich, & Hill 1997a).
The line of choice for ground-based near-infrared searches of obscured
BLRs in nearby galaxies is
Pa at 1.8751
µm (Table 4).
Under Case B recombination
(Osterbrock 1989),
this line is one-third
the strength of H and is
twelve times stronger than
Br
at 1.8751
µm (Table 4).
Under Case B recombination
(Osterbrock 1989),
this line is one-third
the strength of H and is
twelve times stronger than
Br
 2.1655, the next best
diagnostic line (e.g.,
Goldader et al. 1995).
This huge gain in intensity more than
compensates the slightly larger optical depth due to extinction at the
shorter wavelength of Pa
(see 4th column in Table 4).
2.1655, the next best
diagnostic line (e.g.,
Goldader et al. 1995).
This huge gain in intensity more than
compensates the slightly larger optical depth due to extinction at the
shorter wavelength of Pa
(see 4th column in Table 4).
Another important AGN diagnostic line in the K band is
[Si VI] 1.962.
The existence of five-times ionized silicon
ions requires energies larger than 167 eV
(Table 4). This forbidden
line has been detected in a number of optically selected Seyfert 2
galaxies with a strength comparable to that of [Fe VII]
6087
(roughly a tenth the strength of
H ), as
expected from photoionization by a AGN power-law continuum
(Oliva & Moorwood
1990;
Greenhouse et al. 1993;
Marconi et al. 1994;
Oliva et al. 1994;
Thompson 1995,
1996).
Near-infrared spectroscopic surveys of ULIGs
have confirmed the optical results: the fraction of objects with
genuine AGNs (with a BLR or strong [Si VI]
1.962 feature) is
at least ~ 20 - 25%, but reaches ~ 35 - 50% for those
objects with log[Lir /
L
), as
expected from photoionization by a AGN power-law continuum
(Oliva & Moorwood
1990;
Greenhouse et al. 1993;
Marconi et al. 1994;
Oliva et al. 1994;
Thompson 1995,
1996).
Near-infrared spectroscopic surveys of ULIGs
have confirmed the optical results: the fraction of objects with
genuine AGNs (with a BLR or strong [Si VI]
1.962 feature) is
at least ~ 20 - 25%, but reaches ~ 35 - 50% for those
objects with log[Lir /
L ] > 12.3.
Nevertheless, the
presence of an AGN in ULIGs does not necessarily imply that AGN
activity is the dominant source of energy in these objects. A more
detailed look at the AGNs in these ULIGs is needed to answer this
question.
] > 12.3.
Nevertheless, the
presence of an AGN in ULIGs does not necessarily imply that AGN
activity is the dominant source of energy in these objects. A more
detailed look at the AGNs in these ULIGs is needed to answer this
question.
| Hydrogen Recombination Lines | High-Ionization Lines | ||||
| Line |
(µm)
| F/FH
| A /
AH
| Line |  (eV) (eV)
|
| H
| 0.4861 | 1.00 | 1.48 | [S IX] 1.252 µm | 328 |
| H
| 0.6563 | 2.85 | 1.00 | [Si X] 1.430 µm | 351 |
| Pa
| 1.0938 | 0.090 | 0.45 | [Si XI] 1.932 µm | 401 |
|
Pa
| 1.2818 | 0.162 | 0.34 | [Si VI] 1.962 µm | 167 |
| Pa
| 1.8751 | 0.332 | 0.18 | [Ca VIII] 2.321 µm | 128 |
| Br
| 2.1655 | 0.0275 | 0.14 | [Si VII] 2.483 µm | 205 |
| Br
| 4.0512 | 0.0779 | 0.05 | [Si IX] 3.935 µm | 303 |
A strong linear correlation has long been known to exist between the
continuum (or, equivalently, bolometric) luminosities of broad-line
AGN and their emission-line luminosities (e.g.,
Yee 1980;
Shuder 1981;
Osterbrock 1989).
This correlation has often been used to argue that
the broad-line regions in AGNs are photoionized by the nuclear
continuum. If this is the case, the broad-line-to-bolometric
luminosity ratio is a measure of the covering factor of the BLR (e.g.,
Osterbrock 1989).
This correlation can be used to estimate the
importance of the AGN in powering ultraluminous infrared galaxies
(Veilleux et al. 1997b,
1999b).
In ULIGs powered uniquely by an AGN,
we expect the broad-line luminosities to fall along the correlation
for AGNs. Any contribution from a starburst will increase the
bolometric luminosity of the ULIG without a corresponding increase in
the broad-line luminosity. Starburst-dominated ULIGs are therefore
expected to fall below the "pure-AGN" correlation traced by the
optical quasars in a diagram of
LH(BLR) plotted as a function of
Lbol. The data of ULIGs with optical and obscured
BLRs are shown in Figure 3. A discussion of the
methods and
assumptions which were used to create this figure is presented in
Veilleux et al. (1999a).
Figure 3 strongly suggests that most (~
80%) of the ULIGs with optical or near-infrared BLRs in the 1-Jy
sample are powered predominantly by the quasar rather than by a
powerful starburst. In other words, the detection of an optical
or near-infrared BLR in a ULIG (about 20% of the total 1-Jy sample)
appears to be an excellent sign that the AGN is the dominant energy
source in that ULIG.
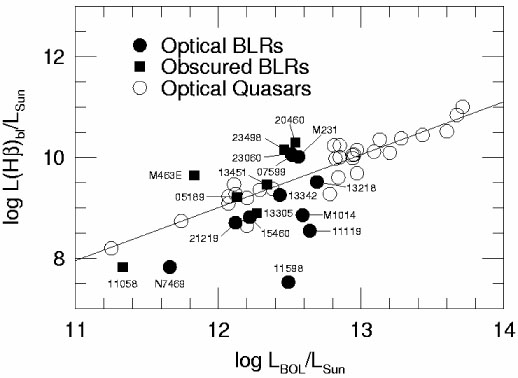
|
Figure 3. Dominant energy source of ultraluminous infrared galaxies based on their broad-line luminosities. The solid line is the best fit for the optical quasars. From Veilleux et al. (1999b). |