Copyright © 1997 by Annual Reviews. All rights reserved
| Annu. Rev. Astron. Astrophys. 1997. 35:
637-675 Copyright © 1997 by Annual Reviews. All rights reserved |


The Local Group provides a sample of bulges in which one can determine the stellar distribution functions on a star-by-star basis, which allows a more detailed analysis than is possible based on the integrated properties of more distant bulges/haloes. In this comparison, one must be careful to isolate the essential features because there is much confusing detail, both observational and theoretical, specific to individual galaxies.
Obvious questions that can be addressed most efficiently locally include possible differences, similarities, or smooth(?) gradients in properties - kinematics, chemical abundance distribution, age distribution, scale-lengths, profiles, etc - from inner bulges to outer haloes, and from bulges to inner disks. Different tracers can be used that allow comparisons between, for example, globular clusters and field stars.
2.1. Milky Way Galaxy
Let us adopt for the moment the working definition of the bulge as the component constituting the amorphous stellar light in the central regions of the Milky Way. Although one might imagine that the Milky Way bulge can be studied in significantly more detail than is possible in other galaxies, our location in the disk restricts our view such that this is true only several kiloparsecs from the Galactic center. Most of the Galactic bulge is obscured by dust and stars associated with the foreground disk. We illustrate the situation in Figure 1 below.

|
Figure 1. An optical image of the central Galaxy, adapted from that published by Madsen & Laustsen (1986). The field covered is 70° × 50°. The Galactic plane is indicated by the horizontal line, and the Galactic center by the cross in the center of the image. Also shown is an outline of the COBE/DIRBE image of the Galactic center (smooth solid curve, from Arendt et al 1994), an approximate outline of the Sagittarius dSph galaxy (complex curve, from Ibata et al 1997), with the four Sgr dSph globular clusters identified as asterisks; Baade's Window (heavy circle below the center); the field of the DUO microlensing survey, which contains some of the other microlensing fields (solid square, overlapping the Sgr dSph rectangle; Alard 1996); the four fields for which deep HST color-magnitude data are available (open squares, near Baade's Window); and the six fields surveyed for kinematics and metallicity by Ibata & Gilmore (1995a, b: black/white outline boxes). The location of Kepler's supernova is indicated as a circle, north of the Galactic plane. Other features of relevance include the extreme extinction, which prevents optical/near-IR low-resolution observations of the bulge within a few degrees of the plane, and the pronounced asymmetry in the apparent bulge farther from the plane. The dust that generates the apparent peanut shape in the COBE/DIRBE image is apparent. The asymmetry at negative longitudes north of the plane, indicated by a large dotted circle, is the Ophiuchus star formation region, some 160 pc from the Sun. The Sagittarius spiral arm contributes significantly at positive longitudes in the plane. |
CHEMICAL ABUNDANCES Chemical abundances of K and M giants in the central regions of the Galaxy have been determined by a variety of techniques, ranging from high-resolution spectra that allow elemental abundance analyses to intermediate-band photometry. Application to Baade's Window - approximately 500-pc projected distance from the Galactic center - determined that the metallicity distribution function (calibrated onto a [Fe/H] scale) of K/M giants is broad, with a maximum at ~ -0.2 dex (i.e. ~ 0.6 of the solar iron abundance) and extending down to at least -1 dex and up to at least +0.5 dex (e.g. McWilliam & Rich 1994, Sadler et al 1996). It remains unclear to what extent these upper and lower limits are a true representation of the underlying distribution function and to what extent they are observational bias, set by calibration difficulties and/or sensitivities of the techniques. Furthermore, the identification of foreground disk stars remains difficult.
At larger Galactocentric distances, Ibata & Gilmore (1995a, b) utilized fiber spectroscopy down many lines of sight to mimic "long-slit spectroscopy" of the Galactic bulge, in order to facilitate a direct comparison between the Milky Way bulge and those of external spiral galaxies. They obtained spectra of about 2000 stars; star count models, stellar luminosity classifications, and kinematics were used to isolate about 1500 K/M-giants from 700 pc to 3.5 kpc (projected distance) from the Galactic Center. These authors estimated metallicities from the Mg`b' index, calibrated against local field stars; thus there is a possible zero-point offset of up to ~ 0.3 dex, which is dependent on the element ratios of the Bulge stars compared to the local stars. Ibata & Gilmore truncated their distribution function above the solar value, owing to the great similarity in low-resolution spectra between foreground K dwarfs and such metal-rich K giants, which leads to an inability to identify contamination of the bulge sample by disk stars. They find that the outer bulge metallicity distribution function peaks at ~ -0.3 dex, and continues down beyond -1 dex (see Figure 2 below).

|
Figure 2. Chemical abundance distribution functions, normalized to unity, derived by Wyse & Gilmore (1995), except where noted. The distributions are, from top to bottom, the solar neighborhood stellar halo (Laird et al 1988); the outer Galactic bulge (Ibata & Gilmore 1995b), truncated at solar metallicity; the younger stars of the solar neighborhood; a volume-complete sample of local long-lived stars; a volume-complete sample of local thick-disk stars; the column integral through the disk abundance distribution for the sum of the long-lived thin disk and the thick disk. |
Minniti et al (1995) present the metallicity distribution function for ~ 250 K/M giants in two fields at projected Galactocentric distances of R ~ 1.5 kpc. Their results are calibrated only for stars more metal-poor than ~ -0.5 dex, and one of their fields was selected with a bias against high metallicities. Their data for their unbiased field again shows a broad distribution function, which is approximately flat from -1 to +0.3 dex. Minniti et al (1995) also summarize (and list the references to) results from extant photometric chemical abundance determinations (e.g. Morrison & Harding 1993); in general, these agree neither with each other nor with spectroscopic determinations. Further work is clearly needed.
The few large-scale kinematic surveys of the bulge (Ibata & Gilmore 1995a, b, Minniti et al 1995) find no convincing evidence for an abundance-kinematics correlation within the bulge itself, after corrections for halo stars and disk stars (see also Minniti 1996).
The most striking aspects of the bulge K/M giants' metallicity distribution function are its width and the fact that there is little if any radial gradient in its peak (modal) value when one considers only spectroscopic determinations. Further data are required to determine whether or not the wings of the distribution are also invariant. Certainly the very late spectral-type M giants have a significantly smaller scale height than do the K giants (Blanco & Tendrup 1989), a fact that could be a manifestation of either a metallicity gradient in the high-metallicity tail of the distribution function or of an age gradient, with a small scale height, metal-rich, younger population that is concentrated to the Galactic plane. Star formation clearly occurs in the very center of the Galaxy (e.g. Gredel 1996), so that a distinction between inner disk and bulge stellar populations remains problematic, and perhaps semantic, in the inner few hundred parsecs of the Galaxy. External disk galaxies do show color gradients in their bulge components, but the amplitude is luminosity dependent and expected to be small for bulges like that of the Milky Way (Balcells & Peletier 1994).
The little evidence there is concerning the stellar metallicity distribution of older stars in the inner disk is also somewhat confusing. An abundance gradient with the mean rising ~ 0.1 dex/kpc towards the inner Galaxy, but for data only relevant to Galactocentric distances of 4-11 kpc, has been plausibly established for F/G stars of ages up to 1010 years (Edvardsson et al 1993; their table 14 - their few older stars show no evidence for a gradient). A similar amplitude of metallicity gradient is seen in open clusters older than 1 Gyr, but for clusters that are exterior to the solar circle (e.g. Friel 1995). Earlier data for K giants, however, suggest no radial abundance gradient, with a mean [Fe/H] ~ -0.3 from exterior to the Sun to within 1 kpc of the center (Lewis & Freeman 1989), even though such stars should be no older than the F/G sample. Clearly, however, the abundance range that contains most of the bulge stars overlaps that of the disk, with probable disk gradients that are smaller than the range of the bulge metallicity distribution function. This is of particular interest given the correlations, discussed below, between the colors of bulges and inner disks in external galaxies (de Jong 1996, Peletier & Balcells 1996).
As discussed further below, the mean metallicity of field bulge stars is significantly above that of the globular cluster system of the Milky Way, even if only the inner, more metal-rich "disk" globular clusters with mean metallicity of ~ -0.7 dex (e.g. Armandroff 1989) are considered.
A characterization of the width of the metallicity distribution comes from the fact that the distributions for both Baade's Window (Rich 1990) and for the outer bulge (Ibata & Gilmore 1995b) are consistent with the predictions of the "Simple Closed Box" model of chemical evolution. This is in contrast to the disk of the Milky Way, at least in the solar neighborhood, which has a significantly narrower metallicity distribution and indeed a shortage of low-metallicity stars compared to this model (the "G-Dwarf problem"). This of course does not mean that any or all of the assumptions inherent in the simple closed box model were realized during bulge formation and evolution, but it is rather a way of quantifying the greater width of the observed metallicity distribution in the bulge compared to the disk at the solar neighborhood, two locations that have the same mean metallicity.
Elemental abundances provide significantly more information than does metallicity because different elements are synthesized by stars of different masses and hence on different time scales (e.g. Tinsley 1980, McWilliam 1997). Different scenarios for the formation of the bulge could in principle be distinguished by their signatures in the pattern of element ratios (Wyse & Gilmore 1992). The available data are somewhat difficult to interpret, in part owing to small number statistics (e.g. McWilliam & Rich 1994, Sadler et al 1996), but this can be rectified with the coming 8- to 10-m class telescopes.
AGE ESTIMATES RR Lyrae stars, the traditional tracers of an old metal-poor population, are found in significant numbers along bulge lines of sight, at characteristic distances that place them close to the Galactic center (Oort & Plaut 1975). This has been taken as supporting evidence for an old bulge. Indeed, Lee (1992) argued that, for a stellar population of high mean metallicity to produce significant numbers of RR Lyrae stars from the metal-poor tail of the chemical abundance distribution, the population must be older than a metal-poor population with the same RR Lyrae production rate. Lee hence concluded that the bulge contained the oldest stars in the Galaxy, older than the stars in the field halo. But are the observed RR Lyrae stars indeed part of the metal-rich bulge, or of the metal-poor stellar halo, whose density of course also peaks in the inner Galaxy?
The samples of RR Lyrae available for this experiment have been small. However, a side benefit of the recent interest in microlensing surveys of the Galactic bulge (e.g. OGLE, MACHO, DUO) has been well-defined catalogs of variable stars, including RR Lyraes. In an analysis of the projected spatial distribution of DUO RR Lyraes - which have been segregatedstatistically by metallicity based on periods and fit to density laws of halo, disk, and bulge - Alard (1996) has found that the great majority of RR Lyrae stars in his catalog are not associated with the bulge, but rather with the thick disk and halo. Nonetheless, a detectable fraction of the most metal-rich RR Lyrae variables of the 1400 discovered by DUO do indeed belong to a concentrated bulge population. These stars comprise only about 7% of the whole RR Lyrae sample. Thus, the microlensing surveys have in fact made the first discovery of true bulge RR Lyraes. The intermediate-abundance RR Lyraes are primarily thick disk, whereas the most metal poor are primarily halo, from this analysis.
Analysis of the variable stars detected by the IRAS satellite (mostly Mira variables) implied a significant intermediate-age population (e.g. Harmon & Gilmore 1988), perhaps that traced by the carbon stars (Azzopardi et al 1988, Westerlund 1991) and the strong red clump population (e.g. Pacynski et al 1994a, b).
Renzini (1994, 1995) has emphasized that the relative strength of the red clump and red giant branches is dependent on helium content as well as on age and argues that age is not an important parameter for stellar populations older than 1 Gyr. Thus, should the bulge stars be of high helium content - as expected if they had been found to be super-metal-rich - then the observed red clump would be consistent with an old age. However, the fact that the mean metallicity of the bulge is now established (from unbiased tracers) to be below the solar value, with a correspondingly much-reduced helium abundance, makes this unlikely.
Understanding the effects of dust along the line of sight to the central regions is crucial. The analysis of infrared (IR) data reduces some of the reddening problems of optical data, but again the interpretation in terms of stellar properties is far from unambiguous. A deep near-IR luminosity function for Baade's window was obtained by Tiede et al (1995). Houdashelt (1996), in a detailed analysis of the available IR photometry and spectroscopy for stars in Baade's Window, concluded that a typical age of perhaps 8 Gyr and mean metallicity of [Fe/H]~ -0.3 are most consistent.
Optical/near-IR color-magnitude diagrams that extend well below the main sequence turnoff region may be used to make quantitative statements about mean age and age ranges of stellar populations: modulo uncertainties in this case that are due to large and highly variable extinction, to extreme crowding in the inner fields, and to the contribution of foreground stars. In spite of these complications, Ortolani et al (1995) concluded, from a comparison of HST color-magnitude data for the horizontal branch luminosity functions of an inner globular cluster with ground-based data towards Baade's Window, that the stellar population of the bulge is as old as is the globular cluster system and, furthermore, shows negligible age range. This contrasts with earlier conclusions based on prerefurbishment HST color-magnitude data for Baade's Window (Holtzman 1993), which suggests a dominant intermediate-age population. Future improved deep HST color-magnitude data are eagerly awaited.
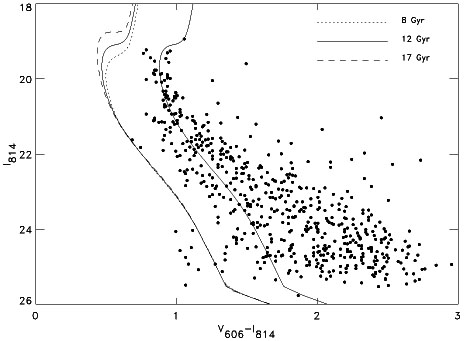
An example of the information that can be obtained is given in Figure 3, which is a V-I, V color-magnitude diagram from WFPC2 data (planetary camera) obtained as part of the Medium Deep Survey (S Feltzing, private communication).
|
|
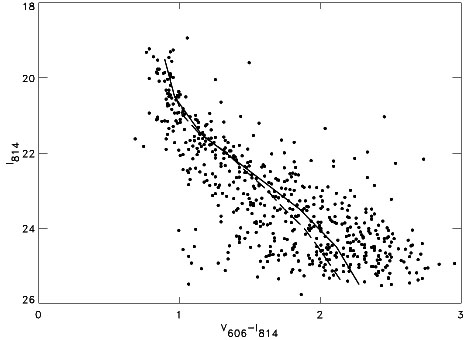
Figure 3. The HST WF/PC2 color-magnitude data for the Galactic bulge, for the field at (l, b) = (3.6, -7) identified in Figure 1, from the Medium Deep Survey. (a) The panel shows the data. Overlaid, from a by-eye fit, is a 12-Gyr isochrone for metallicity [Fe/H] = -0.25, from Bertelli et al (1994), together with a range of other ages plotted to one side, to illustrate the precision required and the need for independent determinations of extinction at each point. (b) The panel shows the mean line through the data, excluding extreme points, together with the ridge line from similar HST data for the globular cluster 47 Tucanae (Santiago et al 1996), arbitrarily offset to match the mean line. |
BULGE STRUCTURE The only single-parameter global
fit to the surface brightness of the combined halo plus bulge of the
Galaxy that implicitly assumes they are a single entity, is that by
de Vaucouleurs & Pence
(1978).
From their
rather limited data on the visual surface brightness profile of the
bulge/halo interior to the solar Galactocentric distance, when assuming an
R1/4-law profile, they derived a projected effective
radius of
2.75 kpc, which may be deprojected to a physical half-light radius of
3.75 kpc. As shown by
Morrison (1993),
the de Vaucouleurs & Pence density profile,
extrapolated to the solar neighborhood, is brighter than the observed
local surface brightness of the metal-poor halo, which was obtained
from star counts, by 2.5 magnitudes. Because the density profile of the
outer halo is well described by a power law in
density, with index
 (r)
(r)
 R-3.2, and oblate spheroidal axis ratio of about 0.6
(Kinman et al 1966,
1994,
Wyse & Gilmore
1989,
Larsen & Humphreys
1994),
this result actually provides the first, though unappreciated, evidence
that the central regions of the galaxy are predominantly bulge light and
that the bulge light
falls off faster than does the outer halo light. That is, the bulge and
halo are not a single
structural entity. More generally, because the spatial density
distribution of the stellar metal-poor halo is well described by a power
law, whereas the inner bulge (see below) is well
described by another power law of much smaller scale length, the
apparent fit of the single
R1/4-law profile must be spurious and misleading.
R-3.2, and oblate spheroidal axis ratio of about 0.6
(Kinman et al 1966,
1994,
Wyse & Gilmore
1989,
Larsen & Humphreys
1994),
this result actually provides the first, though unappreciated, evidence
that the central regions of the galaxy are predominantly bulge light and
that the bulge light
falls off faster than does the outer halo light. That is, the bulge and
halo are not a single
structural entity. More generally, because the spatial density
distribution of the stellar metal-poor halo is well described by a power
law, whereas the inner bulge (see below) is well
described by another power law of much smaller scale length, the
apparent fit of the single
R1/4-law profile must be spurious and misleading.
The limiting factors in all studies of the large-scale structure of the stellar Galactic bulge are the reddening, which is extreme and patchy, and severe crowding. The systematic difference between the best pre-HST photometry in crowded regions and the reality, as seen by HST, is now well appreciated after many studies of globular clusters. Near-IR studies within a few degrees of the Galactic plane show optical extinction that has a random variation, on angular scales down to a few arcseconds, of up to AV ~ 35 mag (e.g. Catchpole et al 1990). At southern Galactic latitudes, however, more than a few degrees from the plane, extinction is both low (typically EB-V ~ 0.2) and surprisingly uniform, as is evident in the optical bulge image in Figure 1 and as exploited by Baade. Nonetheless, detailed star-count modeling of the inner galaxy (Ibata & Gilmore 1995a, b; M Unavane, private communication) demonstrates that extinction variations are still larger in their photometric effects than are the photometric signatures of different plausible structural models. This sensitivity to extinction, together with the extreme crowding that bedevils ground-based photometry, is well illustrated by the recent history of structural analyses of the inner Milky Way disk by the OGLE microlensing group, based on low spatial-resolution optical data. Their initial analysis of their data suggested that there is no inner disk in the Galaxy, only prominent foreground spiral structure (Paczynski et al 1994a). After more careful consideration of crowding, and of alternative extinction models, this detection of a "hole" in the disk was retracted (Kiraga et al 1997). The true spatial density distribution of the inner disk remains obscure.
There are many analyses of the surface brightness structure of the bulge, which range from straightforward counts of late-type stars perpendicular to the plane along the minor axis (cf Frogel 1988 for references) through extensive two-dimensional analyses (Kent et al 1991), to detailed inversions of photometric maps (e.g. Blitz & Spergel 1991, Binney et al 1997). In all such cases, extreme reddening near the plane precludes reliable use of low spatial resolution data with |b| < 2, irrespective of the techniques used. The zero order properties of the photometric structure of the bulge are fairly consistently derived in all such studies and determine ~ 350 pc for the minor axis exponential scale height, as well as significant flattening, with minor:major axis ratio of ~ 0.5. Together with a disk scale length of around 3 kpc, this result places the Milky Way galaxy within the scatter of late-type disk galaxies on the correlation between disk and bulge scale lengths of Courteau et al (1996).
Considerable efforts have been expended in the last decade to determine the three-dimensional structure of the Galactic bulge. These efforts began at a serious level with analyses of the kinematics of gas in the inner Galaxy, following the prescient work of Liszt & Burton in the 1980s (see Liszt & Burton 1996, Burton et al 1996 for recent reviews and introductions to the subject), by Gerhard & Vietri (1986) together with much other work reviewed by Combes (1991). A resurgence of interest in bar models has been motivated by (a) new dynamical analyses (e.g. Binney et al 1991, Blitz et al 1993), (b) the realization that near-IR data might reflect the pronounced molecular gas asymmetry (Blitz & Spergel 1991), (c) gravitational microlensing results (Paczynski et al 1994b), and (d) the new photometric COBE/DIRBE data (Weiland et al 1994).
It appears that all galaxies in their central regions have non-axisymmetric structures, often multiple structures such as bars within bars (e.g. Shaw et al 1995, Friedli et al 1996). The distinction between inner spiral arms, bars, lenses, local star formation, and the like is perhaps of semantic interest, except in cases where the distortions are of sufficiently large amplitude such as to affect the dynamical evolution. Is the Galaxy like that? The significant question is the existence of a substantial perturbation to the inner density distribution, and gravitational potential, associated with a bar. Secondary questions are the shape of that bar and its relationship to the disk or to the bulge. The extant three-dimensional models of the central regions of the Milky Way derived from the COBE surface photometry depend on systematic asymmetries of the derived "dust-free" surface brightness with longitude of less than 0.4 mag in amplitude, after statistical correction for extinction that is locally some orders of magnitude larger in amplitude (Binney et al 1997). Thus the models are crucially sensitive to reddening corrections made on a scale of 1.5 degrees (the COBE/DIRBE resolution), although reddening varies on much smaller scales (Figure 1).
The models also provide only a smooth description of most of the known foreground disk structure such as can be seen in Figure 1 - the Ophiuchus star formation region, the Sagittarius (Sgr) spiral arm, etc - and do not work at low Galactic latitudes. A model of this disk must be subtracted before bulge parameters can be derived. The best available description of the stellar bulge derived this way suggests axis ratios x:y:z ~ 1.0:0.6:0.4 (Binney et al 1997).
It is worth noting that this model, although the best currently available, fails to explain either the high spatial frequency structure in the photometric data or the observed high rate of gravitational microlensing towards the inner Galaxy (Bissantz et al 1997), in addition to having remaining difficulties with the details of the gas kinematics in the inner Galaxy. Little evidence exists for non-axisymmetry in the potential from analyses of stellar kinematics - radial velocity surveys find consistency with an isotropic oblate rotator model (e.g. Ibata & Gilmore 1995, Minniti 1996), though with a mild bar allowed (Blum et al 1995). Although evidence for a bar is seen in proper-motion surveys (Zhao et al 1994, who analyzed proper motions from Spaenhauer et al 1992), this is very dependent on the distances assigned to the stars. Thus it must be emphasized that the best available models for the inner Galaxy remain poor descriptors of the very complex kinematics and spatial distribution of the gas (see Liszt & Burton 1996) and of the complex kinematics of some samples of stars (e.g. Izumiura et al 1995).
Analysis of the photometric structure of the inner galaxy is a very active field of research, which promises major progress in the next few years with the availability of the Infrared Space Observatory (ISO) imaging survey data of the inner galaxy (Perault et al 1996). ISO improves on the ~ 1° spatial resolution of COBE, as it has typically 6-arcsec resolution in surveys. These data provide for the first time a detailed census of individual stars and the ISM in the inner Galaxy, with sufficient resolution and sensitivity to see single stars at the Galactic center, thereby allowing the first ever determination of the true three-dimensional spatial distribution of the inner Galaxy.
We consider the kinematics of the Galactic bulge, the halo, and the disk, and their implications for formation models, below (section 5).