


3.6. Absolute Magnitudes and Linear Diameters of Double Galaxies
The calculation of the luminosity function for double galaxies per
unit volume and their distribution function by linear diameter meets with
a number of difficulties produced by a variety of selection effects.
Deriving the luminosity function
 (M1,
M2) from the catalogue
*(M1,
M2), where M1 and
M2 are the absolute magnitudes
of the brighter and fainter components of the pair, has already been
examined analytically by
White and Valdes (1980)
and Arakelyan (1983a,
b),
but even with the strong simplification of an analytical
approach, notable difficulties have appeared.
(M1,
M2) from the catalogue
*(M1,
M2), where M1 and
M2 are the absolute magnitudes
of the brighter and fainter components of the pair, has already been
examined analytically by
White and Valdes (1980)
and Arakelyan (1983a,
b),
but even with the strong simplification of an analytical
approach, notable difficulties have appeared.
In this section, we will limit our discussion to the observational data and estimate the role of the most basic selection factors in determining the distribution of double galaxies by absolute magnitude.
The distribution of 1170 double galaxies in the catalogue according to
measured radial velocity is shown as a histogram in
figure 14.
From the given photometric limit of the catalogue, it has a shape comparable
to that of the luminosity function
(M1,
M2) and, to a lesser
extent, displays the selection criteria for pairs.
The most luminous objects in the catalogue have a velocity
V0  15000 km/s. The mean radial velocity of double galaxies is 6350 km/s.
The dashed line in the figure indicates the distribution of model
galaxies with the postulated luminosity function (3.2).
It describes the distribution of double systems including only the brighter
catalogue component.
The mean velocity for these `half-pairs' is the nearly matching 6190 km/s.
The full line indicates the distribution of model pairs which appear
in the sample with both components brighter than magnitude 15.7.
The mean radial velocity of these is 2890 km/s, or, to put it another
way, their effective depth in space is reduced
by more than a factor of two in comparison with the `half-pairs'.
The strong selection against distant pairs occurs among the model sample
because of the assumption of independence of the absolute magnitudes of
the two pair members.
To bring the model and catalogue distributions in
figure 14 into
agreement for independent M1 and M2
it would be necessary to
increase the luminosity of the components of the M-pairs by a factor of
four or five, but since the actual absolute magnitudes of double galaxies
exhibit a strong correlation, the expected distribution changes to the
one shown in the dashed line in figure 14.
15000 km/s. The mean radial velocity of double galaxies is 6350 km/s.
The dashed line in the figure indicates the distribution of model
galaxies with the postulated luminosity function (3.2).
It describes the distribution of double systems including only the brighter
catalogue component.
The mean velocity for these `half-pairs' is the nearly matching 6190 km/s.
The full line indicates the distribution of model pairs which appear
in the sample with both components brighter than magnitude 15.7.
The mean radial velocity of these is 2890 km/s, or, to put it another
way, their effective depth in space is reduced
by more than a factor of two in comparison with the `half-pairs'.
The strong selection against distant pairs occurs among the model sample
because of the assumption of independence of the absolute magnitudes of
the two pair members.
To bring the model and catalogue distributions in
figure 14 into
agreement for independent M1 and M2
it would be necessary to
increase the luminosity of the components of the M-pairs by a factor of
four or five, but since the actual absolute magnitudes of double galaxies
exhibit a strong correlation, the expected distribution changes to the
one shown in the dashed line in figure 14.
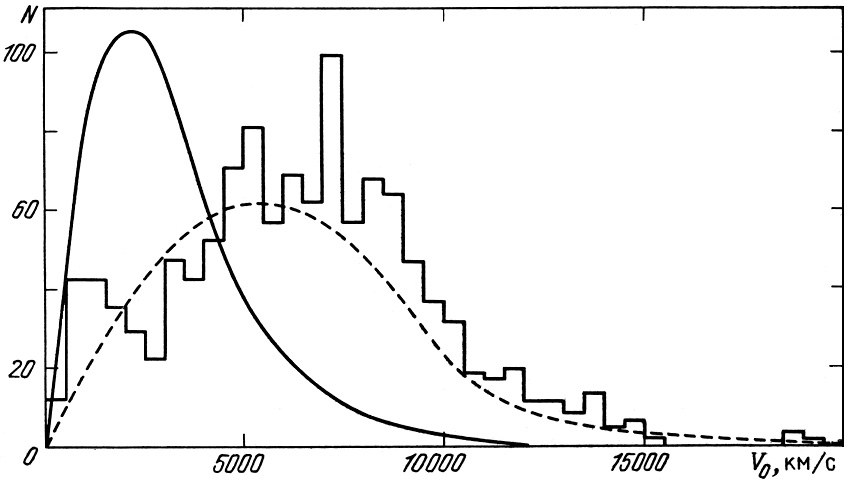 |
Figure 14. |
In addition to this photometric selection of pairs, an additional selection is introduced by the isolation criterion. Among 242 M-pairs only 171 satisfy the basic criteria for distinguishing them from projected pairs. The mean radial velocity of these (3300 km/s) compared with the mean for pairs not satisfying the criterion (1890 km/s), shows another selection effect: the isolation criterion often excludes pairs of close galaxies with low luminosity.
Note further the observed excess in the number of catalogue pairs with radial velocities below 2000 km/s. Apparently this is explained by the fact that many nearby double systems belong to the local supercluster of galaxies. Additional peaks are noticeable in the histogram N(V0), which agree with the presence of the Perseus and Coma clusters.
The role of various selection effects may be estimated from the data in Table 7, which presents the distribution of the number of real and model double galaxies in absolute magnitude bins of width 0.5 magnitude. The second and third columns of the table show the number of catalogue galaxies broken down into brighter and fainter pair components. The absolute magnitudes are presented on Holmberg's photometric system, mHoc. The distributions of the members of model pairs are given in the fourth through the eighth columns, which are the same as given in Table 6. The last line of the table gives the mean value of the absolute magnitude and its standard deviation for every sub-sample.
According to the adopted luminosity function (3.2), the mean absolute magnitude of galaxies selected with a limiting magnitude of 15.7 should be <M> = - 19.28m. Comparing this with the mean absolute magnitude of the components of M-pairs from every sub-sample we may identify the following selection effects.
1. The basic fact that a pair was present in the catalogue with both components reduces the luminosity of the galaxies by roughly a factor of three (<M> = - 17.97m ± 0.08m for the combined samples P+N), but as was remarked above, for the catalogue pairs the observed strong correlation between component luminosities means that the photometric selection should not be as strong for these objects.
2. The isolation criterion has a tendency to exclude galaxies of low luminosity (<M>P = -18.34m versus <M>N = -17.08m); that is, the selection criterion in part compensates for the photometric selection of double galaxies by luminosity.
3. Components of optical pairs (o) or members of systems (s) will occur preferentially at the bright end of the luminosity function of double galaxies. We remarked on this tendency in an earlier paragraph.
The combination of the selection factors we have described has the net effect that in the mean, galaxies from the M-pairs are fainter (-18.72m) than single galaxies (-19.28m). Examining the data in the second or third columns of Table 7 we see that the catalogue pairs have a markedly higher luminosity than the model ones. Part of this difference may result from an incorrect choice of the zero point in the absolute magnitude scale of the M-galaxies, or from a real luminosity excess in the catalogue pairs. To examine this we will use as a control the catalogue of isolated galaxies of Karachentseva (1973).
We first point out several salient features of the selection of the galaxies for this catalogue. Galaxies with angular diameter a0 are considered isolated if any significant neighbours with diameters ai, a0/4 < ai < 2a0 have an angular separation from the galaxy under consideration greater than 20ai. Such a basic definition of a zone of avoidance around a galaxy has a characteristic radius ~ 400 kpc. The catalogue of isolated galaxies (total number of objects, n = 1051) covers the same area of the sky and has the same limiting magnitude m = 15.7 as does the catalogue of pairs. At the present time, the program of measuring radial velocities for the isolated galaxies has not been completed. Only for 300 objects with known radial velocities do we have information on the absolute magnitudes MHoc and linear diameters A25, reduced to the standard system following the scheme given in section 2.2.
The mean absolute magnitude of the 300 isolated galaxies is
<MHoc> = - 19.68m ±
0.09m, with standard deviation
 M =
1.52m.
For the fainter and brighter components of K-pairs we have for comparison
<MHoc> = - 19.91m ±
0.05m,
M =
1.32m, and
<MHoc> = - 20.57m ±
0.05m,
M =
1.13m.
As we see, not only the brighter but also the fainter members of pairs are
characteristically brighter in luminosity by comparison with isolated
galaxies. To satisfy the mean value <M> simultaneously in the
model and catalogued
isolated galaxies, it would be necessary to shift the zero point of the
luminosity function by -0.40 magnitudes
(3).
M =
1.52m.
For the fainter and brighter components of K-pairs we have for comparison
<MHoc> = - 19.91m ±
0.05m,
M =
1.32m, and
<MHoc> = - 20.57m ±
0.05m,
M =
1.13m.
As we see, not only the brighter but also the fainter members of pairs are
characteristically brighter in luminosity by comparison with isolated
galaxies. To satisfy the mean value <M> simultaneously in the
model and catalogued
isolated galaxies, it would be necessary to shift the zero point of the
luminosity function by -0.40 magnitudes
(3).
The distribution of 1170 double galaxies from the catalogue by absolute
magnitude is shown as the histogram in figure 15.
The straight lines illustrate the sample luminosity function as given by
(3.2), increased by the volume factor 10-0.6M.
The distribution of 300 isolated galaxies is shown as the points.
These data may be interpreted either as indicating different luminosity
functions for double and single galaxies, or as a shift between them.
To examine this question, it is necessary to understand all of the selection
effects which operate on the distribution of absolute magnitudes of
catalogue pairs.
Computer modelling can indicate the magnitude and direction of selection
effects, but our model, which has ignored the observed correlation between
absolute magnitudes of double galaxies, is too simple to establish any
systematic differences in
(M) between
double and single galaxies.
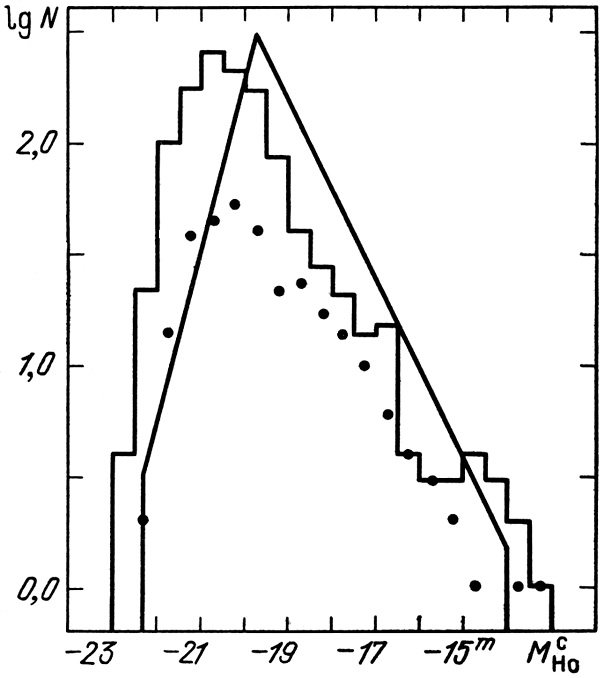 |
Figure 15. |
For quantitative estimates, we note that the components of double systems
(<M> = - 20.24m ± 0.04m) have by
comparison with isolated galaxies (<M> = -
19.68m ± 0.09m) a mean luminosity excess of
100.4 × 0.56
1.7.
An even stronger difference
( M = -
0.88m) was found by
White and Valdes (1980)
for a sample of 63 Turner pairs.
This increase in luminosity for double galaxies may arise from the same
basis as other specific properties of paired systems.
M = -
0.88m) was found by
White and Valdes (1980)
for a sample of 63 Turner pairs.
This increase in luminosity for double galaxies may arise from the same
basis as other specific properties of paired systems.
Aside from their absolute magnitudes, an equally important
integral characteristic of galaxies is their linear diameters.
Figure 16 shows the distribution of double
galaxies by linear
diameter, measured at the standard isophote 25m/sq.arc sec.
Just as with the luminosity function, this distribution is affected by
various apparent selections which deserve special examination and serve
to limit our treatment of the problem.
The mean diameter of the components of the pairs is 24.3 ± 0.7 kpc,
with a standard deviation
A = 11.9 kpc.
For 300 isolated galaxies, <A25> = 24.7 ±
0.9 kpc, and
A = 14.9 kpc.
From this, with an accuracy limited by selection effects, we see
that the linear diameters of double galaxies are not significantly
different from those of single systems.
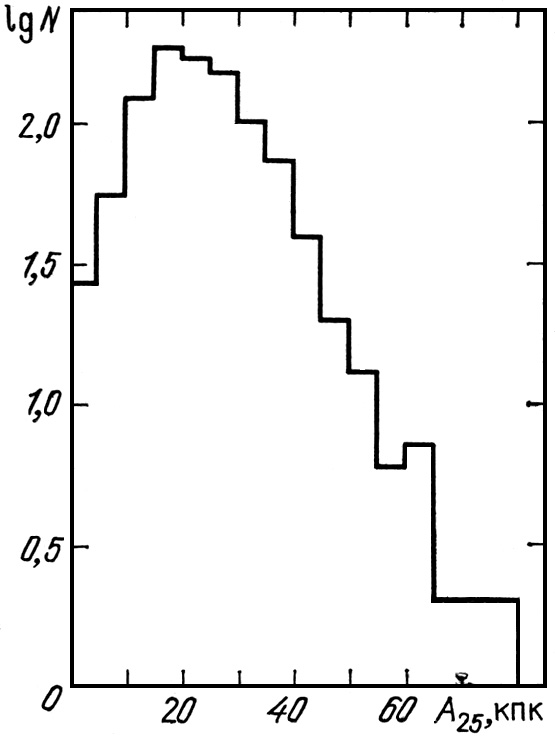 |
Figure 16. |
Finally, a brief summary. In this chapter, numerous properties of the distribution of double galaxies have been examined according to certain basic parameters. We found that the definition of double systems in the catalogue using certain photometric limits and basic isolation considerations, to distinguish them from galaxies close only in projection, is subject to various selection effects. As a result we find that many characteristics of the catalogue systems of double galaxies are strongly distinguished from the same characteristics of the pairs examined according to their distribution per unit volume.
To estimate the importance of selection effects, we modelled the apparent distribution of galaxies using computer methods and random distributions. Applying the isolation criterion to the artificial fields it is possible to show that the catalogue sample should include a significant number of false pairs. Among every 10 pairs in the catalogue, one is pure chance (optical), three to four may be considered non-isolated pairs composed of members of groups or clusters, and only five or six are dynamically distinct double systems.
After accounting for false pairs and for errors in the measurement of radial velocities, the distribution of model double galaxies according to their radial velocity difference may be described as an exponential form with a mean of 120 km/s.
The distribution of double systems according to projected linear separation between components, X, is affected by strong, exponentially increasing selection as a result of which, for X > 100 kpc less than 10% of all pairs satisfy the isolation criterion. The catalogue objects are, for the most part, very tight systems and have a mean separation <X> = 38 kpc. Per unit volume the distribution of projected separation for double galaxies satisfies the gamma distribution with mean 65 kpc. The greater selectivity of the criterion for wide pairs and, further, the presence among them of interloping false non-isolated systems, complicates attempts to measure the actual occurrence of double galaxies.
The components of double systems exhibit an excess luminosity (by a factor 1.7) in comparison with single galaxies. In addition, for components of pairs one notices a strong correlation of luminosities which cannot be accounted for by the various selection effects. The observed characteristics probably result from the simultaneous epoch of formation of double galaxies.
Measurement of the bivariant true luminosity function,
(M1,
M2)
for pair members is a current but still problematical area.
Success in its resolution must await a more correct calculation of the
various selection factors involved.
3 in the system mHo, not including the effects of light absorption because they are satisfactorily close to zero. Back.