


5.5. Surface Brightness of Single and Double Galaxies
One of the general indicators of galactic structure is the mean
surface brightness,
B .
This may be measured by various techniques depending on the chosen
isophotal diameter system. The values of surface brightness presented in
Appendix 2 are determined from
.
This may be measured by various techniques depending on the chosen
isophotal diameter system. The values of surface brightness presented in
Appendix 2 are determined from
 |
(5.2) |
In other words, the integrated apparent magnitude of the galaxy mHoc is equivalent to the quantity BT0 in the RCBG catalogue, corresponding to the area within the standard isophote at 25m / sq.arc sec. The transformation from observed diameters and magnitudes to the (a25, mHoc) system was described in section 2.2. As usual, surface brightness is expressed in stellar magnitudes per square arcsecond.
The differentiation of galaxies by surface brightness, according to their location in pairs, groups, clusters or the field, has received insufficient attention in the literature. Bertola et al. (1971) noted that among 600 Zwicky (1971) compact galaxies, the percentage of double and multiple objects was noticeably higher than among single galaxies. The possibility of a relation between a galaxy's surface brightness and the location of its nearest neighbour was considered by Kormendy (1977), Zonn (1974) and Arakelyan and Magtesian (1981). These last two studies compared the catalogues of isolated (Karachentseva, 1973) and double (Karachentsev, 1972) galaxies, but their results appear contradictory. According to Zonn (1974), isolated and double spiral galaxies have the same mean surface brightness, while isolated ellipticals appear to be somewhat more compact. According to Arakelyan and Magtesian (1981), however, there is no significant difference between elliptical objects in both catalogues, but an excess surface brightness for the spiral components of double systems. A fresh and detailed comparison of the surface brightness for single and double galaxies was made by Karachentsev et al. (1985). In that study, the apparent magnitude and angular diameters of isolated galaxies were transformed to the common system (a25, mHoc) used for double galaxies. The following results are taken from that work.
Figure 38 shows the distribution of single galaxies (filled circles) and double galaxies (open circles) of all types, as a function of the surface brightness calculated according to (5.2). Both distributions follow a symmetric normal distribution very closely, with almost identical means (22.72 ± 0.02 for single galaxies, and 22.69 ± 0.02 for double galaxies), but with significantly different standard deviations, 0.82 and 0.60 respectively. Therefore, the presence of close neighbours to a galaxy does not change the maximum of the distribution but it is possible that the selection of objects for the catalogue may have excluded objects with extremely high or extremely low surface brightnesses.
 |
Figure 38. |
Excluding contact pairs, for which the respective magnitudes
of the galaxies were calculated from a total magnitude using (2.11),
we constructed the bivariant distribution of
B for
the brighter and fainter components of double systems.
It agreed excellently with the bivariant normal distribution, with
the same mean and standard deviation, and a correlation coefficient of
+0.37.
The high degree of correlation between the surface brightnesses of pair
members may probably be explained as due to their simultaneous formation.
Thus, the correlation of
B
for components of
close pairs is no higher than for wide pairs, since interactions as a cause
of this correlation should not induce any particular value.
The dependence of the mean surface brightness of double and isolated galaxies on morphological and spectral types is shown in table 26, which lists the mean value of each quantity and the standard deviation of the mean. These data show that the mean surface brightness of double galaxies decreases monotonically on going from objects with absorption line spectra to objects with rich emission spectra. The amplitude of this effect is around 0.45 magnitudes and appears to be similar for galaxies of different morphological types. This trend is in agreement with the compendium by Arakelyan (1975) in that high surface brightness is anticorrelated with the presence of strong emission characteristics. This correlation between spectral types and compactness may have several causes, which we will now examine.
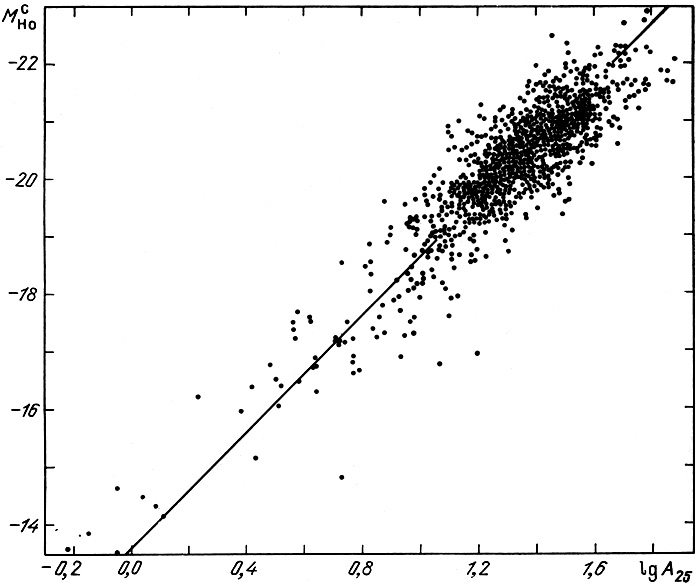 |
Figure 39. |
Figure 39 shows the distribution of 974 pair
members by absolute magnitude and linear diameter.
The straight line indicates the mean surface brightness,
<B> = 22.69m / sq.arc sec.
Dwarf galaxies are characterized by their greater mean compactness compared
to giant systems. The quantitative relation between mean surface brightness
and linear diameter is
 |
(5.3) |
where the diameter A25 is in kiloparsecs. It follows from table 27 that increasing richness in the emission line spectrum correlates with a decrease in both luminosity and linear diameter. This trend may be explained by postulating that the evolution of dwarf galaxies proceeds at a slower rate, so that they may normally retain their original levels of gas and therefore have the raw material for active star formation at the present epoch.
Consider again the data in table 26, showing the connection between surface brightness and morphological type. For components of double systems, the mean surface brightness is practically the same for all structural types, while isolated galaxies display a change on going from late types to early types. The greatest difference is observed for E and S0 galaxies, and isolated elliptical galaxies exceed pair components by a full magnitude in surface brightness. This agrees with Zonn (1974) but contradicts Arakelyan and Magtesian (1981). A detailed analysis shows that this last study is strongly affected by selection. Among isolated elliptical galaxies a considerable fraction are listed in the Zwicky catalogue as compact or very compact. Arakelyan and Magtesian used measurements of galaxy diameters from the MCG catalogue and therefore did not consider about 60% of the isolated E galaxies, predominantly the most compact ones, which has the effect of producing an artificially low estimate of the mean surface brightness. It is possible that field elliptical galaxies form a separate category of objects with structural properties not encountered among elliptical members of systems. Thus, Kormendy (1977) noticed the absence around isolated galaxies of the extended haloes characteristic of E galaxies with nearby massive companions. Kormendy ascribed this property to the recent operation of tidal effects.
Arakelyan and Magtesian
(1981)
demonstrated that the mean surface
brightness of double galaxies decreases with increasing linear
separation, asymptotically approaching the value for isolated
galaxies for X  200 kpc.
We show this dependence for the entire sample of 487 physical double
systems in figure 40 by the filled circles,
with error bars indicating the standard deviation of the mean.
Excluding the single point in the interval 80 - 100 kpc,
these values fall along the descending curve, which drops by
200 kpc.
We show this dependence for the entire sample of 487 physical double
systems in figure 40 by the filled circles,
with error bars indicating the standard deviation of the mean.
Excluding the single point in the interval 80 - 100 kpc,
these values fall along the descending curve, which drops by
 B =
0.7m.
Karachentsev et al. (1985)
examined two effects which might produce such a dependence.
B =
0.7m.
Karachentsev et al. (1985)
examined two effects which might produce such a dependence.
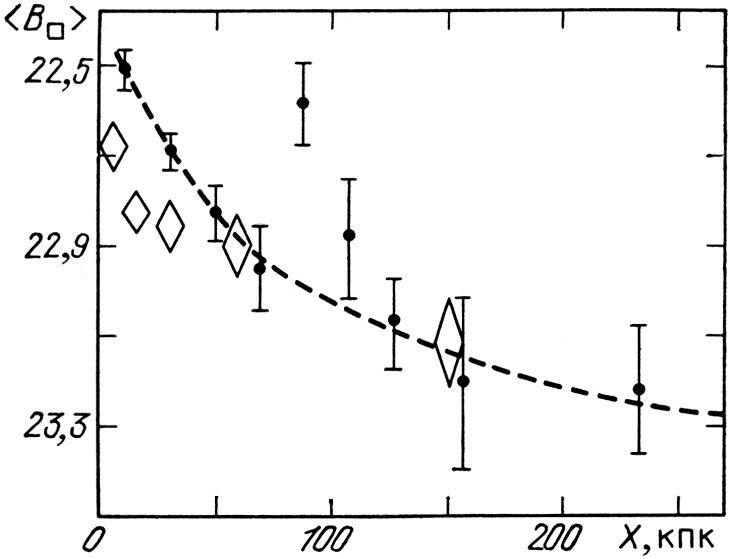 |
Figure 40. |
1. In tight pairs in which the mutual separation of the components is comparable to their diameters, tidal stripping of the outer regions of the disk will occur. The tidal effects increase with greater proximity of the galaxies to one another, so that members of contact pairs should have the highest surface brightness.
2. The decreasing number of compact objects on passing from tight pairs to wide pairs may be a selection effect. The inclusion of pairs in the catalogue depends on the angular diameters and apparent magnitudes of the galaxies, as much as on the angular separation. Two galaxies with a large separation will have a higher probability of satisfying the isolation criteria, the larger their angular diameter is compared to the surrounding field galaxies. Therefore, galaxies in wide pairs should be distinguished by lower surface brightness than members of tight pairs.
To estimate such selection we again used the results of the modelling of the apparent distribution of galaxies and the resulting selection of double systems (see section 3.1). The dependence of mean surface brightness in the model pairs on their linear separation is shown in figure 40 as diamonds whose height denotes the standard deviation of the mean (9) It follows from these results that selection effects in the catalogue can explain most of the effect observed for the real galaxy pairs. A small part (~ 0.2m) of the surface brightness for members of tight pairs with X < 30 kpc might also be explained by tidal effects during interaction. However, any dynamical changes in the structure of galaxies are not easy to distinguish from possible errors in measuring the diameters of galaxies which are extremely close and, perhaps, overlapping one another.
9 According to the adopted relation
(3.3), the model galaxies have
<B> = 23.63m/sq.arc sec.,
with standard deviation 0.8.
In order to compare the observed and model means we shifted the
model values to a fixed ordinal.
Back.