Copyright © 1998 by Annual Reviews. All rights reserved
| Annu. Rev. Astron. Astrophys. 1998. 36:
189-231 Copyright © 1998 by Annual Reviews. All rights reserved |


It has been known from the early photographic work of Morgan (1958), Sérsic & Pastoriza (1967) that the circumnuclear regions of many spiral galaxies harbor luminous star-forming regions, with properties that are largely decoupled from those of the more extended star-forming disks. Subsequent spectroscopic surveys revealed numerous examples of bright emission-line nuclei with spectra resembling those of HII regions (e.g. Heckman et al 1980, Stauffer 1982, Balzano 1983, Keel 1983). The most luminous of these were dubbed starbursts by Weedman et al (1981). The opening of the mid-IR and FIR regions fully revealed the distinctive nature of the nuclear star formation (e.g. Rieke & Low 1972, Harper & Low 1973, Rieke & Lebofsky 1978, Telesco & Harper 1980). The IRAS survey led to the discovery of large numbers of ultraluminous star-forming galaxies (Soifer et al 1987). This subject has grown into a major subfield of its own, which has been thoroughly reviewed in this series (Soifer et al 1987, Telesco 1988, Sanders & Mirabel 1996). The discussion here focuses on the range of star formation properties of the nuclear regions and the patterns in these properties along the Hubble sequence.
4.1. Star Formation Rates and Physical Properties
Comprehensive surveys of the star formation properties of galactic
nuclei have been carried out using emission-line spectroscopy in
the visible
(Stauffer 1982,
Keel 1983,
Kennicutt et al 1989b,
Ho et al 1997a,
b) and mid-IR
photometry
(Rieke & Lebofsky
1978,
Scoville et al 1983,
Devereux et al 1987,
Devereux 1987,
Giuricin et al 1994).
Nuclear emission spectra with
HII region-like line ratios are found in 42% of bright spirals
(BT < 12.5), with the fraction
increasing from 8% in S0 galaxies
(and virtually zero in elliptical galaxies) to 80% in Sc-Im galaxies
(Ho et al 1997a).
These fractions are
lower limits, especially in early-type spirals, because the star formation
often is masked by a LINER or Seyfert nucleus. Similar detection fractions
are found in 10-µm surveys of
optically selected spiral galaxies, but with a stronger weighting toward
early Hubble types. The nuclear SFRs implied by the
H and IR fluxes span a
large range, from a lower detection limit of ~ 10-4
M
and IR fluxes span a
large range, from a lower detection limit of ~ 10-4
M year-1 to well over 100
M
year-1 in the most luminous IR galaxies.
year-1 to well over 100
M
year-1 in the most luminous IR galaxies.
The physical character of the nuclear star-forming regions changes
dramatically over this spectrum of SFRs. The nuclear SFRs in most
galaxies are quite modest, averaging ~ 0.1
M
year-1 (median 0.02
M
year-1)
in the H sample of
Ho et al (1997a)
and ~ 0.2
M
year-1 in the (optically selected) 10-µm samples of
Scoville et al (1983),
Devereux et al (1987).
Given the
different selection criteria and completeness levels in these surveys,
the SFRs are reasonably consistent with each other, and this suggests that
the nuclear star formation at the low end of the SFR spectrum typically
occurs in moderately obscured regions
(AH ~
0-3 mag) that are not physically dissimilar from normal disk HII regions
(Kennicutt et al
1989b,
Ho et al 1997a).
However, the IR observations also reveal a population of more luminous
regions, with LFIR ~ 1010-1013
L, and
corresponding SFRs on the order of 1-1000
M
year-1
(Rieke & Low 1972,
Scoville et al 1983,
Joseph & Wright
1985,
Devereux 1987).
Such high SFRs are not seen
in optically selected samples, mainly because the luminous starbursts
are uniquely associated with dense molecular gas disks
(Young & Scoville
1991
and references therein), and for normal gas-to-dust ratios, one expects
visible extinctions of several magnitudes or higher. The remainder of this
section
focuses on these luminous nuclear starbursts because they represent a
star formation regime that is distinct from the more extended star
formation in disks and because these bursts often dominate the total
SFRs in their parent galaxies.
The IRAS all-sky survey provided the first comprehensive picture of this upper extreme in the SFR spectrum. Figure 6 shows a comparison of the total 8- to 1000-µm luminosities (as derived from IRAS) and total molecular gas masses for 87 bright IR-luminous galaxies, taken from the surveys of Tinney et al (1990), Sanders et al (1991). Tinney et al's sample (open circles) includes many luminous but otherwise normal star-forming galaxies, while Sanders et al's brighter sample (solid points) mainly comprises starburst galaxies and a few AGNs. Strictly speaking, these measurements cannot be applied to infer the nuclear SFRs of the galaxies because they are low-resolution measurements and the samples are heterogeneous. However, circumnuclear star formation sufficiently dominates the properties of the luminous IR galaxies (e.g. Veilleux et al 1995, Lutz et al 1996) that Figure 6 (solid points) provides a representative indication of the range of SFRs in these IRAS-selected samples.
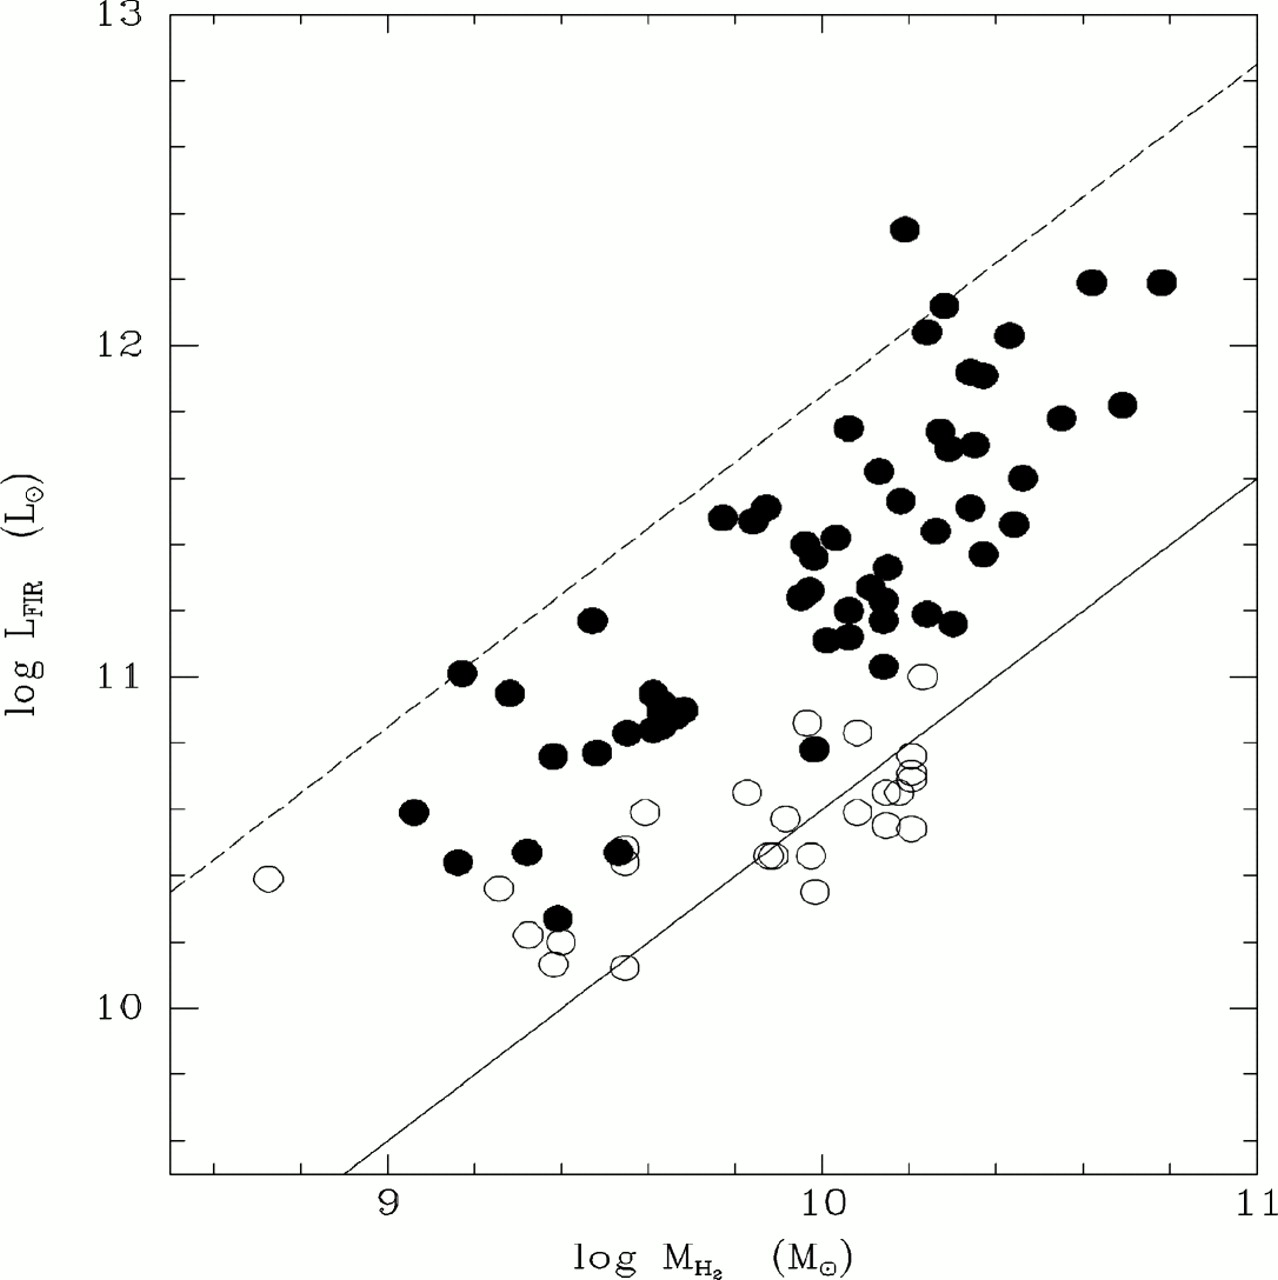 |
Figure 6. Relationship between integrated far-infrared (FIR) luminosity and molecular gas mass for bright IR galaxies, from Tinney et al (1990; open circles) and a more luminous sample by Sanders et al (1991; solid points). The solid line shows the typical L/M ratio for galaxies similar to the Milky Way. The dashed line shows the approximate limiting luminosity for a galaxy forming stars with 100% efficiency on a dynamic time scale, as described in the text. |
The most distinctive feature in Figure 6 is the
range of IR luminosities.
The lower range overlaps with the luminosity function of normal galaxies
(the lower limit of 1010
L is the
sample definition cutoff), but the population of IR galaxies extends
upward to > 1012.5
L. This
would imply SFRs of up to
500 M
year-1 (Equation 4) if starbursts are primarily
responsible for the dust heating, about 20 times larger than the highest
SFRs observed in normal galaxies. Figure 6 also
shows that the luminous
IR galaxies are associated with unusually high molecular gas masses,
which partly accounts for the high SFRs. However the typical SFR per unit
gas mass is much higher than in normal disks; the
solid line in Figure 6 shows the
typical L/M ratio for normal galaxies,
and the efficiencies in the IR galaxies are higher by factors of 2-30
(Young et al 1986,
Solomon & Sage
1988,
Sanders et al 1991).
The H2 masses used here have been
derived using a standard Galactic H2 / CO conversion ratio, and
if the actual conversion factor in the IRAS galaxies is lower,
as is suggested by several lines of evidence, the contrast in
star formation efficiencies would be even larger (e.g.
Downes et al 1993,
Aalto et al 1994,
Solomon et al 1997).
High-resolution IR photometry and imaging of the luminous IR
galaxies reveals that the bulk of the luminosity originates
in compact circumnuclear regions (e.g.
Wright et al 1988,
Carico et al 1990,
Telesco et al 1993,
Smith & Harvey
1996,
and references therein). Likewise, CO interferometric observations
show that a large fraction of the molecular gas is concentrated in central
disks, with typical radii on the order of 0.1-1 kpc and implied surface
densities on the order of 102-105
M
pc-2
(Young & Scoville
1991,
Scoville et al 1994,
Sanders & Mirabel
1996).
Less massive disks with similar gas and SFR surface densities are
associated with the IR-bright nuclei of spiral galaxies (e.g.
Young & Scoville
1991,
Telesco et al 1993,
Scoville et al 1994,
Smith & Harvey
1996,
Rubin et al 1997).
The full spectrum of nuclear starburst regions is considered in the
remainder of this section.
The physical conditions in the circumnuclear star-forming disks are distinct in many respects from the more extended star-forming disks of spiral galaxies, as is summarized in Table 1. The circumnuclear star formation is especially distinctive in terms of the absolute range in SFRs, the much higher spatial concentrations of gas and stars, its burst-like nature (in luminous systems), and its systematic variation with galaxy type.
| Property | Spiral disks | Circumnuclear regions |
|---|---|---|
|
| ||
| Radius | 1-30 kpc | 0.2-2 kpc |
| Star formation rate (SFR) | 0-20
M
year-1 |
0-1000
M
year-1 |
| Bolometric luminosity | 106-1011
L |
106-1013
L |
| Gas mass | 108-1011
M |
106-1011
M |
| Star formation time scale | 1-50 Gyr | 0.1-1 Gyr |
| Gas density | 1-100
M
pc-2 |
102-105
M
pc-2 |
| Optical depth (0.5 µm) | 0-2 | 1-1000 |
| SFR density | 0-0.1
M
year-1 kpc-2 |
1-1000
M
year-1 kpc-2 |
| Dominant mode | steady state | steady state + burst |
|
|
||
| Type dependence? | strong | weak/none |
| Bar dependence? | weak/none | strong |
| Spiral structure dependence? | weak/none | weak/none |
| Interactions dependence? | moderate | strong |
| Cluster dependence? | moderate/weak | ? |
| Redshift dependence? | strong | ? |
|
|
||
The different range of physical conditions in the nuclear starbursts is clearly seen in Figure 7, which plots the average SFR surface densities and mean molecular surface densities for the circumnuclear disks of 36 IR-selected starbursts (Kennicutt 1998). The comparison is identical to the SFR-density plot for spiral disks in Figure 5, except that in this case the SFRs are derived from FIR luminosities (Equation 4), and only molecular gas densities are plotted. HI observations show that the atomic gas fractions in these regions are on the order of only a few percent and can be safely neglected (Sanders & Mirabel 1996). The SFRs and densities have been averaged over the radius of the circumnuclear disk, as measured from high-resolution CO or IR maps, as described by Kennicutt (1998).
 |
Figure 7. Correlation between disk-averaged SFR per unit area and average gas surface density, for 36 IR-selected circumnuclear starbursts. See Figure 5 for a similar comparison for normal spiral disks. The dashed and dotted lines show lines of constant star formation conversion efficiency, with the same notation as in Figure 5. The error bars indicate the typical uncertainties for a given galaxy, including systematic errors. |
Figure 7 shows that the surface densities of gas
and star formation in the nuclear starbursts are 1-4 orders of magnitude
higher than in spiral disks overall. Densities of this order can be
found in large
molecular cloud complexes within spiral disks, of course,
but the physical conditions in many
of the nuclear starbursts are extraordinary even by those standards.
For example, the typical mean densities of the largest molecular
cloud complexes in M31, M33, and M51 are in the range of 40-500
M
pc-2, which corresponds to the lower range of
densities in Figure 7
(Kennicutt 1998).
Likewise, the SFR surface
densities in the 30 Doradus giant HII region, the most luminous
complex in the Local Group, reaches 100
M
year-1 kpc-2
only in the central 10-pc core cluster. The corresponding densities
in many of the starbursts exceed these values, over
regions as large as a kiloparsec in radius.
The starbursts follow a relatively well-defined Schmidt law, with index N ~ 1.4. The nature of the star formation law is discussed further in Section 5, where we examine the SFR vs gas density relation for all of the data taken together. Figure 7 also shows that the characteristic star formation efficiencies and time scales are quite different in the starbursts. The mean conversion efficiency is 30% per 108 years, six times larger than in the spiral disks. Likewise, the gas consumption time scale is six times shorter, about 0.3 Gyr on average. This is hardly surprising - these objects are starbursts by definition - but Figure 7 serves to quantify the characteristic time scales for the starbursts.
As pointed out by Heckman (1994), Lehnert & Heckman (1996), the luminous IR galaxies lie close to the limiting luminosity allowed by stellar energy generation, for a system that converts all of its gas to stars over a dynamical time scale. For a galaxy with dimensions comparable to the Milky Way, the minimum time scale for feeding the central starburst is ~ 108 years; this is also consistent with the minimum gas consumption time scale in Figure 7. At the limit of 100% star formation efficiency over this time scale, the corresponding SFR is trivially
 |
(5) |
The corresponding maximum bolometric luminosity can be estimated using
Equation 4, or by calculating the maximum nuclear energy release
possible from stars over 108 years. The latter is
~ 0.01 
 c2,
where in this case is the
SFR, and is the
fraction of the total stellar
mass that is burned in 108 years. A reasonable value of
for a
Salpeter IMF is about 0.05; it could be as high as 0.2 if the starburst
IMF is depleted in low-mass stars (e.g.
Rieke et al 1993).
Combining these terms and assuming further
that all of the bolometric luminosity is reradiated by the dust yields
c2,
where in this case is the
SFR, and is the
fraction of the total stellar
mass that is burned in 108 years. A reasonable value of
for a
Salpeter IMF is about 0.05; it could be as high as 0.2 if the starburst
IMF is depleted in low-mass stars (e.g.
Rieke et al 1993).
Combining these terms and assuming further
that all of the bolometric luminosity is reradiated by the dust yields
 |
(6) |
Using Equation 4 to convert the SFR to FIR luminosity gives nearly the same coefficient (6 × 10¹¹). This limiting L/M relation is shown by the dashed line in Figure 6, and it lies very close to the actual upper envelope of the luminous IR galaxies. Given the number of assumptions that went into Equation 6, this agreement may be partly fortuitous; other physical processes, such as optical depth effects in the cloud, may also be important in defining the upper luminosity limits (e.g. Downes et al 1993). However, the main intent of this exercise is to illustrate that many of the most extreme circumnuclear starbursts lie near the physical limit for maximum SFRs in galaxies. Heckman (1994) extended this argument and derived the maximum SFR for a purely self-gravitating protogalaxy, and he showed that the most luminous IR galaxies lie close to this limit as well. Note that none of these limits apply to AGN-powered galaxies because the mass consumption requirements for a given mass are 1-2 orders of magnitude lower.
Taken together, these results reveal the extraordinary character of the most luminous IR starburst galaxies (Heckman 1994, Scoville et al 1994, Sanders & Mirabel 1996). They represent systems in which a mass of gas comparable to the entire ISM of a galaxy has been driven into a region on the order of 1 kpc in size, and this entire ISM is being formed into stars, with almost 100% efficiency, over a time scale on the order of 108 years. Such a catastrophic transfer of mass can only take place in a violent interaction or merger, or perhaps during the initial collapse phase of protogalaxies.