


2.2. Redshift Dependence of the Turnover Frequency
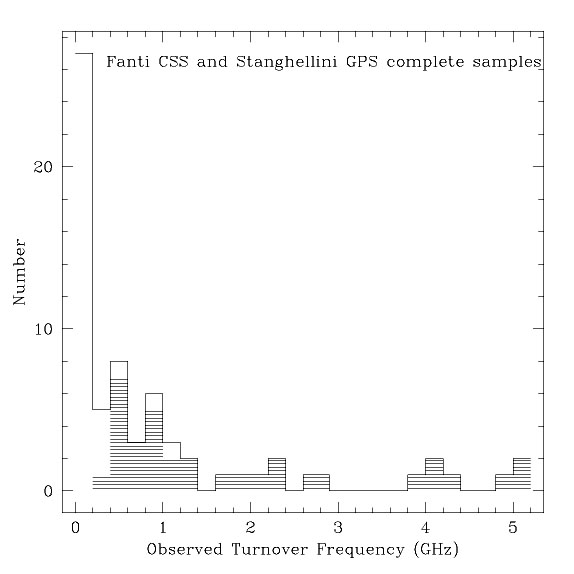
The distribution of the observed turnover frequency for the complete
samples is shown in Figure 3a adapted from
O'Dea & Baum (1997).
There is a strong peak below 200 MHz, a shoulder that extends down to
about 1 GHz, then a fairly flat distribution out to about 5 GHz. The
distribution of rest-frame turnover frequency extends out to 15 GHz
(Fig. 3b). This suggests the existence of a
previously unknown population of sources that peak at high frequencies
(see also
de Vries et al. 1997a;
Edge et al. 1996).
There could be a population of low-redshift sources with turnovers at
high frequency, but they would be missing from our samples because the
surveys only go out to 5 GHz. If a local population of sources with
turnovers at high frequency does exist, they might contribute to
spurious measurements of the cosmic microwave background anisotropy
(Crawford et al. 1996).
Surveys at high frequency,
 10 GHz, will be
needed to search for this population of sources (see, e.g.,
Cooray et al. 1998).
10 GHz, will be
needed to search for this population of sources (see, e.g.,
Cooray et al. 1998).
 |
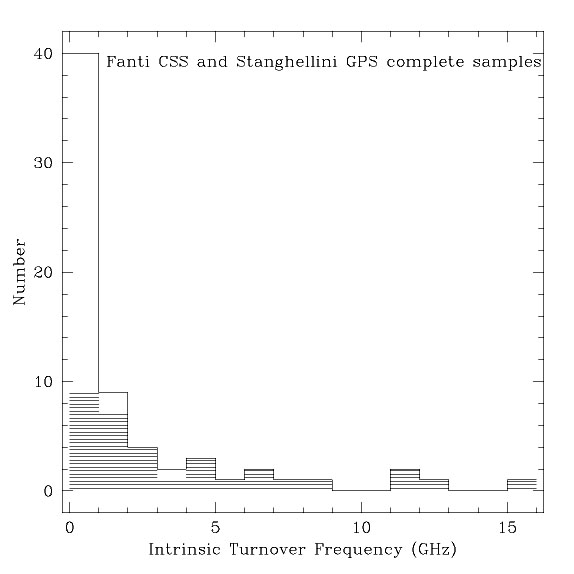 |
Figure 3. (a) Histogram of observed turnover frequency (GHz) for the Fanti et al. CSS sample and the Stanghellini et al. GPS sample (shaded). (b) Same as (a), with turnover frequency given in the source rest frame. Adapted from O'Dea & Baum (1997). |
de Vries et al. (1997a) noted that the GPS sources with high turnover frequencies are found preferentially at high redshift (see also Menon 1983). This can be seen for the combined sample of CSS / GPS sources in the plot of intrinsic turnover frequency versus redshift (Fig. 4). (5) The tendency for the high-redshift (and thus more powerful) quasars to have a higher value of the intrinsic turnover frequency suggests that the sources are more compact at high redshifts. This may reflect the higher density environments expected at high redshift.
 |
Figure 4. Intrinsic turnover frequency vs. redshift for the Fanti et al. CSS sample and the Stanghellini et al. GPS sample. Galaxies are represented by solid squares, and quasars by crosses. Adapted from O'Dea & Baum (1997). |
5 Note that this sample does not show as strong a correlation between turnover frequency and redshift as Menon's (1983) sample of quasars. However, an exact comparison with Menon is not possible, since he used different selection criteria to construct his sample. Back.