


The radio power and linear size are two fundamental observables of radio sources and are the parameters that are the subject of much theoretical work. In this section we present the results on the GPS and CSS sources, and in the next section we compare these properties with those of the large-scale 3CR sources.
6.1. Radio Power and Projected Linear Size
The distribution and trends in the physical properties of the CSS sources have been discussed in great detail by Fanti et al. (1990b). Additional results on CSS sources have been presented by Spencer et al. (1989) and Sanghera et al. (1995). O'Dea & Baum (1997) have presented an analysis of the radio power and linear size of the Fanti et al. CSS sample and Stanghellini et al. GPS sample.
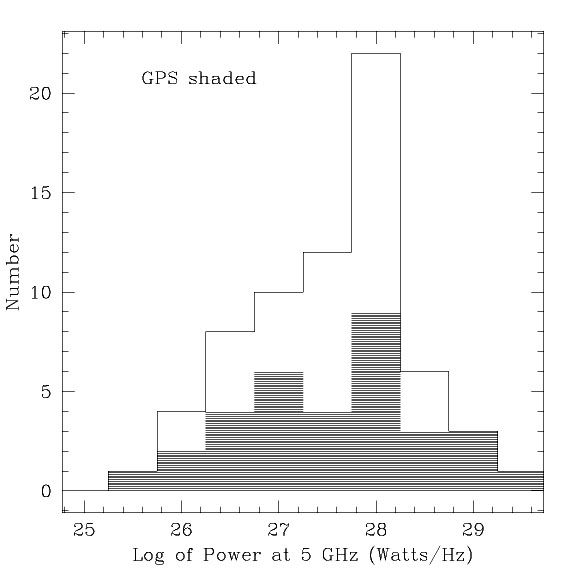
Histograms of the integrated radio power at 5 GHz in the rest frame (adapted from O'Dea & Baum 1997) are shown in Figure 8. It is clear that (1) the GPS and CSS sources have similar radio powers and (2) they are very luminous radio sources. Note that since the quasars tend to be at higher redshifts than the galaxies (section 8), they have larger luminosities than the galaxies. All objects are above the FR 1/FR 2 break power of roughly 1025 W Hz-1 at 5 GHz. Since Doppler boosting is not likely to affect the observed powers of at least the radio galaxies (section 5), these large powers are intrinsic. Any model for these objects must be able to explain their enormous luminosities. In addition, it would be interesting to know how far down in power the GPS and CSS phenomena extends; thus, we eagerly await the results of studies of sources at fainter flux densities.
 |
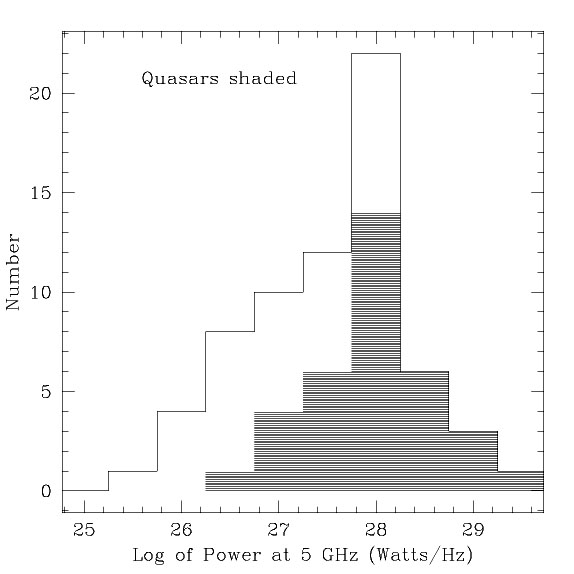 |
Figure 8. (a) Histogram of log of integrated radio power at 5 GHz in the rest frame for the Fanti et al. CSS sample and the Stanghellini et al. GPS sample (shaded). (b) Same as (a), but with the quasars shaded. Adapted from O'Dea & Baum (1997). |
It is interesting to examine the relationship between radio power and total projected source size, since this is a constraint on evolutionary models. Figure 9 shows a scatter diagram, i.e., the radio power is basically independent of linear size. (8) This is consistent with the result above that the GPS and CSS sources have similar ranges of radio power.
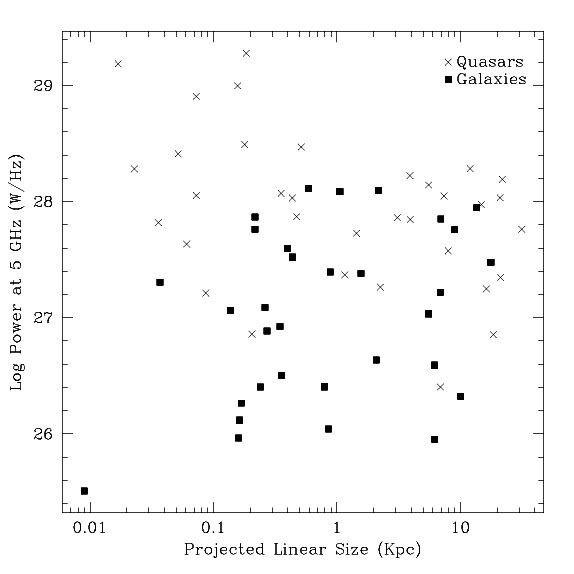 |
Figure 9. Log radio power at 5 GHz vs. the linear size for the Fanti et al. CSS sample and the Stanghellini et al. GPS sample. The quasars are represented by crosses, and the galaxies by solid squares. Adapted from O'Dea & Baum (1997). |
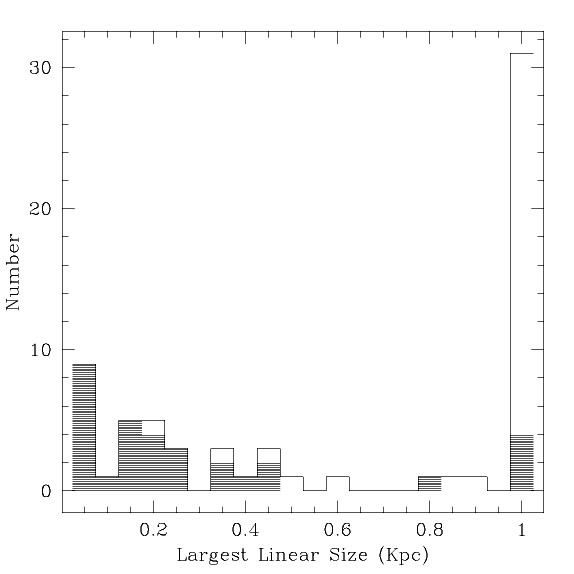
Histograms of the distribution of total projected linear sizes are shown in Figure 10. And the distribution of projected linear size with redshift is shown in Figure 11. The results are the following. (1) There is no trend for projected linear size to vary with redshift (except at high redshifts, where all the objects in these samples are GPS quasars). (2) Over the redshift range where the galaxies and quasars overlap, they have similar ranges of size. Thus, the quasars do not seem to be necessarily strongly foreshortened versions of the galaxies (cf. section 5).
 |
 |
Figure 10. (a) Histogram of the
total projected size for the Fanti et al. CSS sample and the
Stanghellini et al. GPS sample (shaded). Sources in the
rightmost bin have sizes
|
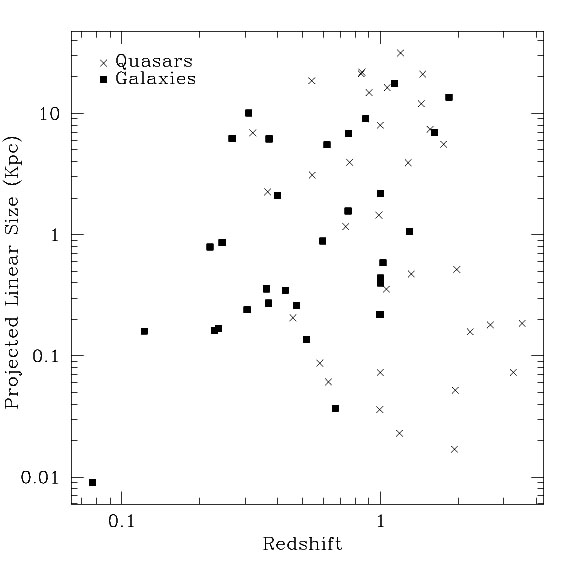 |
Figure 11. Projected linear size as a function of redshift for the combined sample of Fanti et al. CSS sources and Stanghellini et al. GPS sources. Adapted from O'Dea & Baum (1997). |
8 However, note the presence of a group of high-redshift, compact quasars with high radio powers in the upper left of the diagram. Back.
 1 kpc. (b)
Same as (a), but with scale adjusted to emphasize the CSS source
distribution. Sources in the rightmost bin have sizes
1 kpc. (b)
Same as (a), but with scale adjusted to emphasize the CSS source
distribution. Sources in the rightmost bin have sizes