


Malhotra et al. (1997; 2000a, b) have analyzed their survey of a diverse sample of normal galaxies in the [CII]158, [OI]63,145, [NII]122, and [OIII]88,52 µm far-infrared fine-structure lines. Since these galaxies are relatively faint in the far-infrared continuum and fine-structure lines, their work concentrates on the analysis of the strong [CII]158 and [OI]63 µm PDR cooling lines. Using F60 / F100 and FFIR / FB as measures of the dust heating radiation density and star formation activity respectively, they argue that the inverse correlation of [CII]/FIR with both of these (Figure 2 and Figure 3) is evidence that the low values of [CII] / FIR found for warm, infrared-bright galaxies such as IC 860 (< 1.96 × 10⁻⁴) and NGC 4418 (< 1.53 × 10⁻⁴) can be attributed to lower gas heating efficiency arising from positively charged grains for high values of <Go> / n. They suggest that this effect is also responsible for the low [CII] / FIR found in 11 out of 12 ULIGs by Luhman et al. (1998; 2000) (see Section 6). This is further substantiated by a positive correlation between the ratio of the two strong PDR cooling lines [OI]63 / [CII]158 and dust temperature (Figure 4), as is predicted by theoretical PDR models.
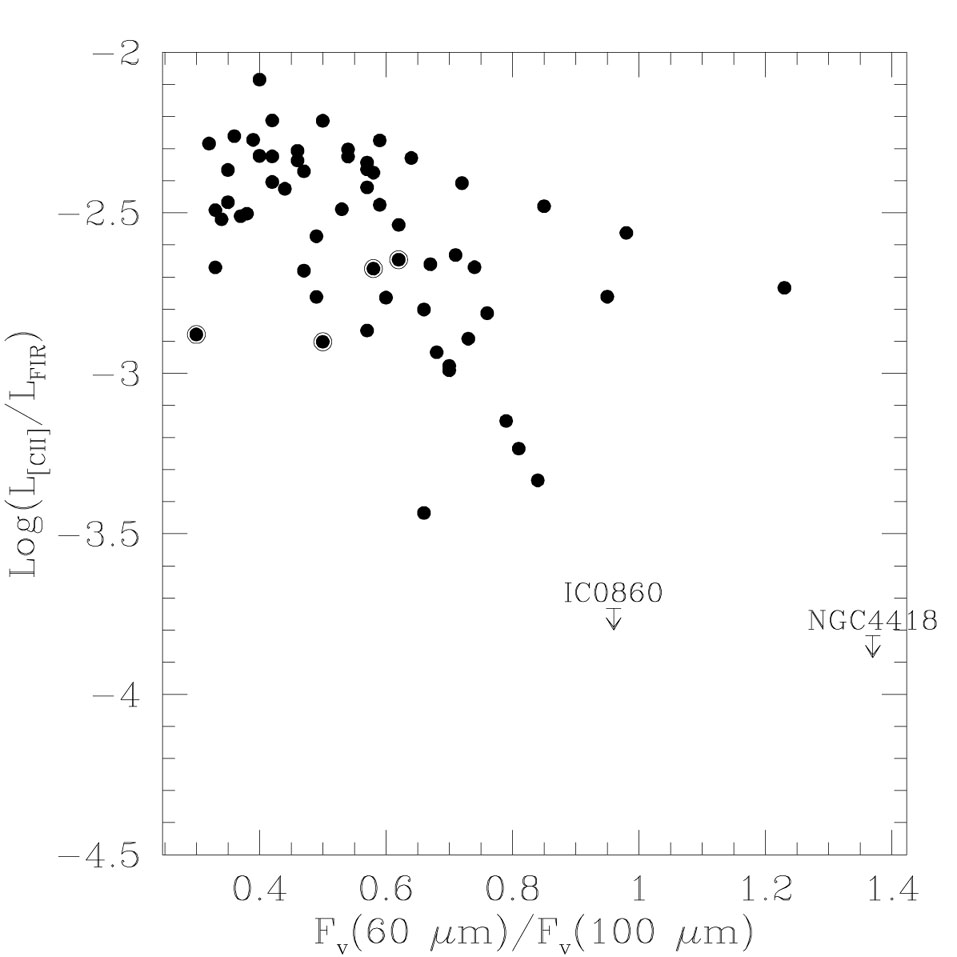 |
Figure 2. The [C II]158/FIR flux ratio versus F60 / F100 from IRAS. Early-type galaxies are denoted by bullseye symbols. From Malhotra et al. (2000a). |
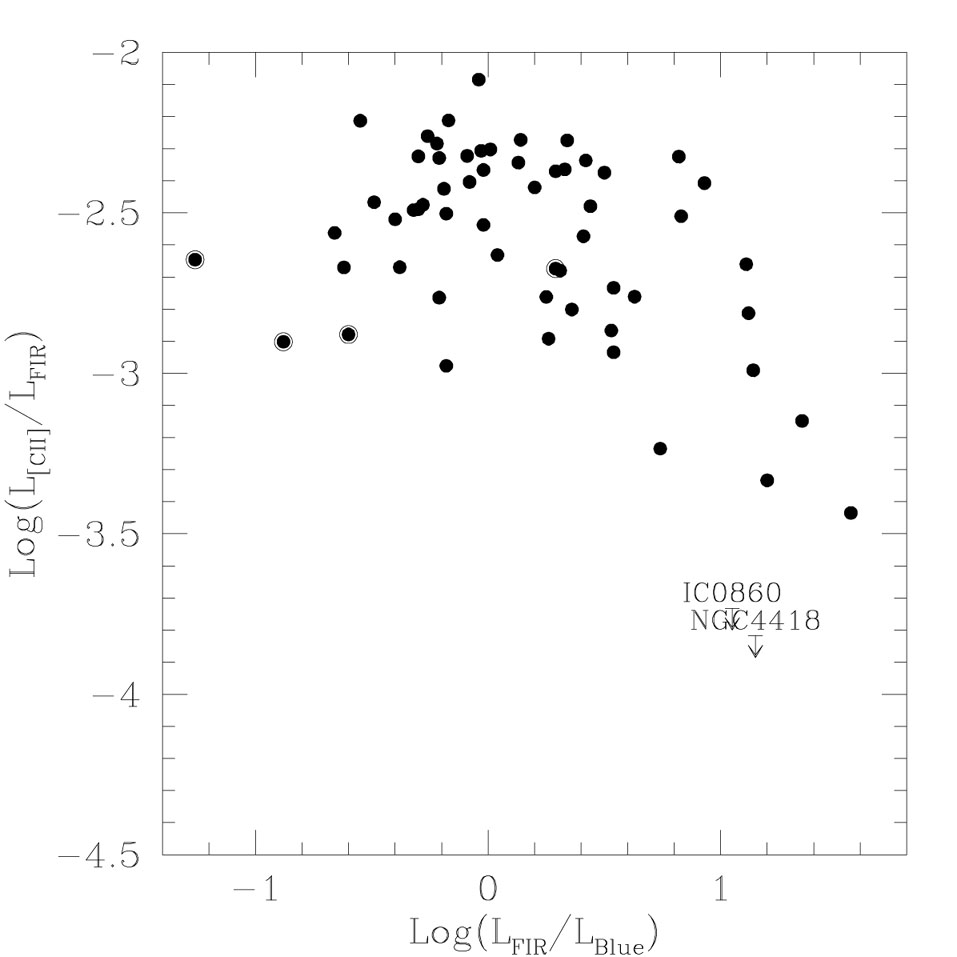 |
Figure 3. The [C II]158/FIR flux ratio versus FFIR / FB. Early-type galaxies are denoted by bullseye symbols. From Malhotra et al. (2000a). |
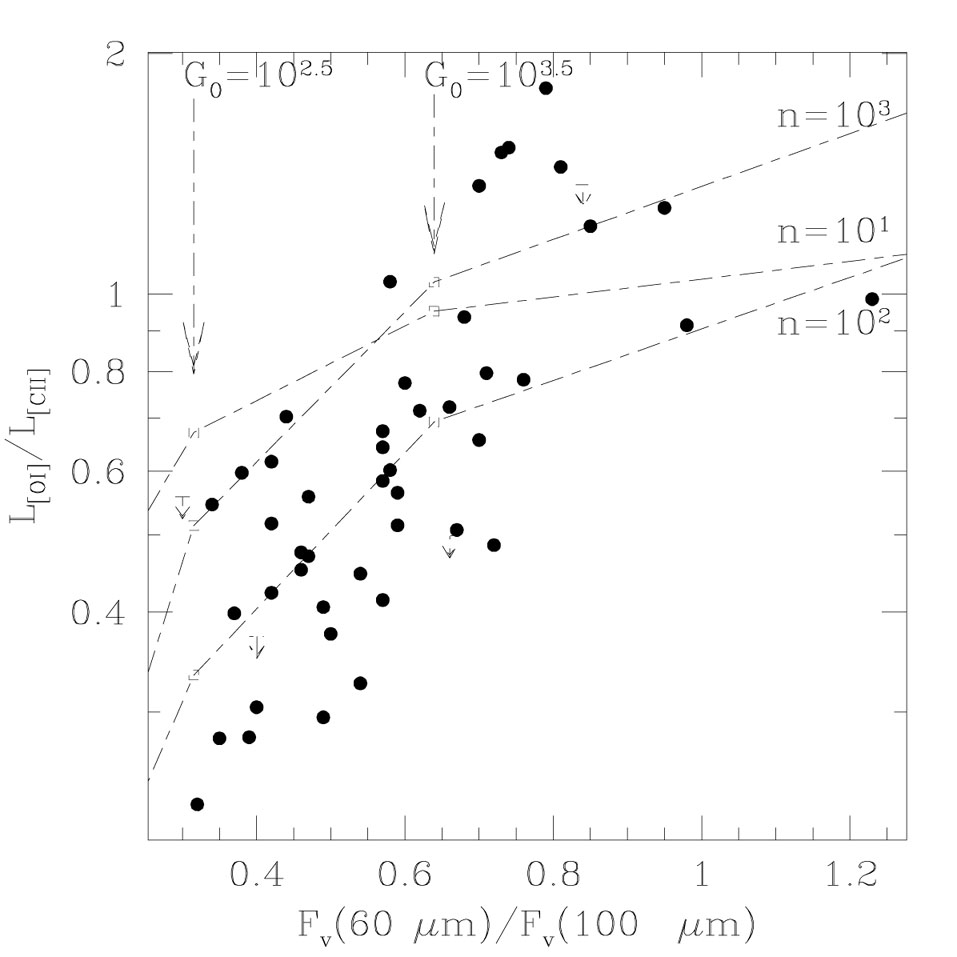 |
Figure 4. The observed correlation between the ratio of the two PDR cooling lines [O I]63 / [C II]158 and F60 / F100 compared with the theoretical PDR models (Kaufman et al. 1999). Although the models are in qualitative agreement with the observed ratios, the observed ratios are lower than model predictions for about half of the sample. From Malhotra et al. (2000b). |
In order to obtain quantitative agreement with the PDR models of
Kaufman et
al. (1999),
they find that it is necessary to significantly correct the observed
[CII] fluxes for a contribution from diffuse ionized gas based on
measured [NII] line fluxes (Figure 5). With this
correction they find that their data is best fit by <
Go >
 n1.4 and conclude that this can be explained if the
PDRs in high <Go> / n galaxies are
associated with embedded H II regions and larger giant molecular
clouds.
n1.4 and conclude that this can be explained if the
PDRs in high <Go> / n galaxies are
associated with embedded H II regions and larger giant molecular
clouds.
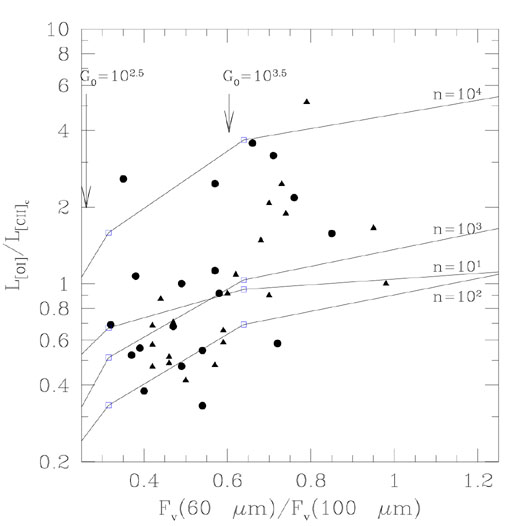 |
Figure 5. As in
Figure 4, but here a correction is made for
[C II] arising from the diffuse ionized medium, based on [N II]122
observations. The triangles denote galaxies where [N II]
2- |
 upper limits were
used. From
upper limits were
used. From