Copyright © 2000 by Annual Reviews. All rights reserved
| Annu. Rev. Astron. Astrophys. 2000. 38: 761-814 Copyright © 2000 by Annual Reviews. All rights reserved |


4.1. Mid-Infrared Surveys
The various ISOCAM surveys trade off depth and area (see
Rowan-Robinson et al
1999
for a compilation). For high-redshift work, the most meaningful are the
15 µm (LW3 filter) surveys. At 6.75 µm
(LW2), the stellar contamination is very high, and a careful screening at
other wavelengths is necessary. Various strategies have been successfully
developed to overcome the cosmic ray-induced glitches that mimic faint
sources
(Starck et al 1999,
Desert et al 1999,
Serjeant et al 1999).
At the time of writing, the published work reports 15 µm
detections of ~ 1400 galaxies, with flux densities between
 30 µJy and
0.3 Jy. Shallow, deep, and
ultra-deep surveys were performed in the Lockman Hole and the Marano
field (IGTES surveys;
Cesarsky and Elbaz
1996,
Elbaz et al 1999a).
They are complemented on the faint end by the surveys made on deep IR fields
centered on the southern and northern Hubble Deep Fields
(Figure 13, see color insert) as observed by
Rowan-Robinson and colleagues [HDF(N):
Serjeant et al 1997,
Aussel et al 1999a
(Figure 13),
Desert et al 1999;
HDF(S):
Oliver et al 2000,
Elbaz et al 1999a].
Even deeper images are available from lens magnification in the
direction of distant clusters
[Metcalfe et al 1999,
Altieri et al 1999
(Figure 13),
Barvainis et al 1999].
Distant clusters also are surveyed to compare the evolution of galaxies
in different environments
(Lemonon et al 1998,
Fadda & Elbaz
1999,
Fadda et al 2000).
The bright end of the luminosity function is explored by the largest
area survey, the 12-square-degree ELAIS program
(Rowan-Robinson et al
1999,
Serjeant et al 1999).
Levine et al (1998)
reported the first results of a program to observe 500 candidate
extragalactic
sources from the IRAS faint source survey with ISOCAM and ISOPHOT
(Levine et al 1998).
This ISO-IRAS faint galaxy survey efficiently picks up moderate redshift
(z = 0.1-0.4) (U)LIRGs.
30 µJy and
0.3 Jy. Shallow, deep, and
ultra-deep surveys were performed in the Lockman Hole and the Marano
field (IGTES surveys;
Cesarsky and Elbaz
1996,
Elbaz et al 1999a).
They are complemented on the faint end by the surveys made on deep IR fields
centered on the southern and northern Hubble Deep Fields
(Figure 13, see color insert) as observed by
Rowan-Robinson and colleagues [HDF(N):
Serjeant et al 1997,
Aussel et al 1999a
(Figure 13),
Desert et al 1999;
HDF(S):
Oliver et al 2000,
Elbaz et al 1999a].
Even deeper images are available from lens magnification in the
direction of distant clusters
[Metcalfe et al 1999,
Altieri et al 1999
(Figure 13),
Barvainis et al 1999].
Distant clusters also are surveyed to compare the evolution of galaxies
in different environments
(Lemonon et al 1998,
Fadda & Elbaz
1999,
Fadda et al 2000).
The bright end of the luminosity function is explored by the largest
area survey, the 12-square-degree ELAIS program
(Rowan-Robinson et al
1999,
Serjeant et al 1999).
Levine et al (1998)
reported the first results of a program to observe 500 candidate
extragalactic
sources from the IRAS faint source survey with ISOCAM and ISOPHOT
(Levine et al 1998).
This ISO-IRAS faint galaxy survey efficiently picks up moderate redshift
(z = 0.1-0.4) (U)LIRGs.
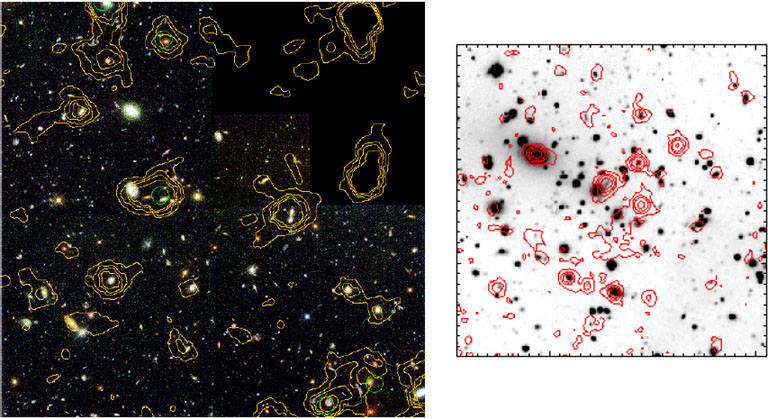 |
Figure 13. Deep mid-infrared surveys. Deep surveys with ISO. Left: ISOCAM 15 µm (LW3) contours (gold) on top of WFPC2 image of the HDF (N). 7 µm sources (LW2) are marked by green circles (Aussel et al 1998). Right: LW3 contours on top of R-band image of Abell 2390 (z = 0.23) (Altieri et al 1999). The outer regions of the image with less integration time has been down-weighted. With the aid of the foreground cluster's lensing amplification this image reaches to < 30 µJy for the < z > ~ 0.7 backgrond galaxies. It thus represents the deepest mid-infrared image obtained by ISOCAM. |