Copyright © 2000 by Annual Reviews. All rights reserved
| Annu. Rev. Astron. Astrophys. 2000. 38: 761-814 Copyright © 2000 by Annual Reviews. All rights reserved |


4.1.1. Source Counts: Evidence for Strong Evolution
Figure 14 (from Serjeant, private
communication;
Elbaz et al 1999a)
gives the integrated and differential source counts derived from these
surveys.
Given the difficulties of reliable faint source detection and photometry
mentioned previously, it is reassuring that the counts of the different
surveys
agree quite well. Starting with IRAS and going to fainter flux densities,
the number counts initially lie on a linear (log-log plot) extrapolation
of the IRAS counts and do not require strong evolution. However, from
> 10 mJy down to 0.4 mJy the counts increase rapidly, with a slope in the
integrated
counts of  = -3. This is
significantly steeper than expected in a Euclidean model without
luminosity/density evolution
( = -2.5). Below 0.4 mJy
down to the faintest flux densities sampled, the slope is flatter
( = -1.6) and the counts
appear to converge. In the differential source counts (right inset of
Figure 14;
Elbaz et al 1999a,
2000)
this leads to a prominent hump peaking at ~ 0.4
mJy. At the peak of the hump the observed source counts are an order of
magnitude
above non-evolution models, obtained by extrapolating the local IRAS 12
µm luminosity function
(Rush et al 1993,
Fang et al 1998).
The mid-infrared source counts require strong cosmic evolution of the
mid-infared emission of galaxies
(Oliver et al 1997,
Roche & Eales
1999,
Clements et al 1999,
Elbaz et al 1999a,
b,
Serjeant et al 1999).
= -3. This is
significantly steeper than expected in a Euclidean model without
luminosity/density evolution
( = -2.5). Below 0.4 mJy
down to the faintest flux densities sampled, the slope is flatter
( = -1.6) and the counts
appear to converge. In the differential source counts (right inset of
Figure 14;
Elbaz et al 1999a,
2000)
this leads to a prominent hump peaking at ~ 0.4
mJy. At the peak of the hump the observed source counts are an order of
magnitude
above non-evolution models, obtained by extrapolating the local IRAS 12
µm luminosity function
(Rush et al 1993,
Fang et al 1998).
The mid-infrared source counts require strong cosmic evolution of the
mid-infared emission of galaxies
(Oliver et al 1997,
Roche & Eales
1999,
Clements et al 1999,
Elbaz et al 1999a,
b,
Serjeant et al 1999).
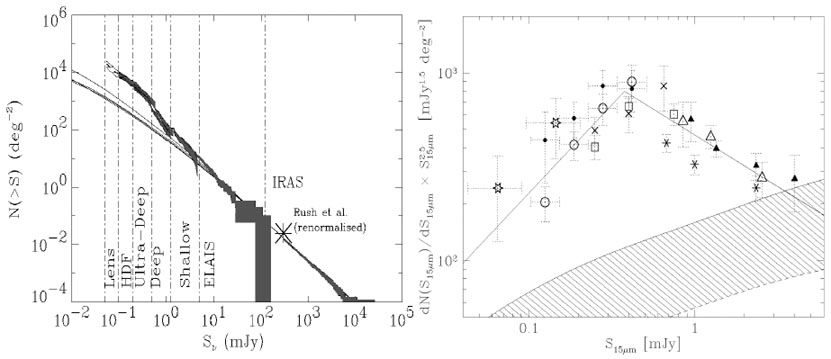 |
Figure 14. Top left: Summary of integrated 15 µm source counts from the different ISO surveys (from Serjeant, private communication; Elbaz et al 1999a; normalizing downward by a factor 1.5 the counts of Serjeant et al 1999), compared to non-evolution models (continuous) matching the IRAS counts (the Rush et al 1993 counts were renormalized downward by a factor of 2). Top right: Differential 15 µm counts with the shaded area marking the counts predicted with non-evolution models (from Elbaz et al 1999a). The counts are normalized to a Euclidean distribution of non-evolving sources, which would have a slope of index -2.5 in such a universe. Data points: A2390 (open stars; Altieri et al 1999, Metcalfe et al 1999), HDF(N) (open circles; Aussel et al 1999a), HDF(S) (filled circles; Elbaz et al 1999a), Marano (open squares, crosses, stars; Elbaz et al 1999a), Lockman hole (open and filled triangles; Elbaz et al 1999a). |
The 15 µm integral number counts agree with model
predictions over more than five orders of magnitude in flux density
(Franceschini et al
1994,
2000,
Pearson &
Rowan-Robinson 1996,
Guiderdoni et al
1997,
1998,
Xu et al 1998,
Roche & Eales 1999).
Common to all these models is the assumption of strong luminosity and/or
density evolution of dusty star formation in bright normal spirals and
starburst galaxies, with varying contributions from AGNs. We now discuss
in more detail the models by
Xu et al (1998),
since they are based on the most recent ISO SWS-ISOPHOT-S spectra of
template
galaxies to determine accurate, mid-IR k-corrections. These are important
because of the structure caused by UIB features in the 6-13 µm
spectra of most galaxies. The models of Pearson, Rowan-Robinson,
Franceschini,
Roche & Eales, and Guiderdoni et al lead to similar results. Xu et al
constructed a local luminosity function from IRAS observations
(Shupe et al 1998)
and assigned to each of these galaxies a mid-IR spectrum composed of three
categories (cirrus/PDR, starburst, AGN, or a mixture). They then
extrapolated
the local luminosity function to higher redshift by applying the appropriate
k-corrections and evolution. The predicted differential, Euclidean,
normalized
source counts for the LW3 ISOCAM filter show distinct differences between
luminosity evolution [L(z)
 (1 + z)3]
and density evolution
[
(1 + z)3]
and density evolution
[ (z)
(1 +
z)4]. For pure density evolution the predicted source counts
are fairly flat, from 1 Jy to 100 µJy. For luminosity
evolution, however, a characteristic bump is predicted at around 300
µJy, with a sharp fall-off of the counts at fainter flux
densities. This is similar to what is actually observed by Elbaz et al
(1999a;
Figure 14),
although the amplitude of the hump in the differential source counts
requires an even steeper evolution than considered by Xu et al [e.g. in
aqn Einstein-de
Sitter universe combination of (1 + z)3 luminosity evolution
and (1 + z)6 density evolution, for the starburst component
only, at z < 0.8-0.9;
Franceschini et al 2000].
The interpretation of the bump is that with luminosity evolution and flat
or even "negative" k-correction (between z = 0.5 and 1;
Elbaz et al 1999b)
the number counts increase initially, with decreasing flux density much
faster
than Euclidean. The unfavorable k-correction and the decreasing slope of
the available comoving volume cause the number counts to drop rapidly with
increasing z for z
(z)
(1 +
z)4]. For pure density evolution the predicted source counts
are fairly flat, from 1 Jy to 100 µJy. For luminosity
evolution, however, a characteristic bump is predicted at around 300
µJy, with a sharp fall-off of the counts at fainter flux
densities. This is similar to what is actually observed by Elbaz et al
(1999a;
Figure 14),
although the amplitude of the hump in the differential source counts
requires an even steeper evolution than considered by Xu et al [e.g. in
aqn Einstein-de
Sitter universe combination of (1 + z)3 luminosity evolution
and (1 + z)6 density evolution, for the starburst component
only, at z < 0.8-0.9;
Franceschini et al 2000].
The interpretation of the bump is that with luminosity evolution and flat
or even "negative" k-correction (between z = 0.5 and 1;
Elbaz et al 1999b)
the number counts increase initially, with decreasing flux density much
faster
than Euclidean. The unfavorable k-correction and the decreasing slope of
the available comoving volume cause the number counts to drop rapidly with
increasing z for z  1. For
sources near the bump, the luminosity evolution model predicts a broad
redshift distribution, with a median at z ~
0.9 but extending with significant probability to redshifts > 2. In
contrast,
the pure density evolution model predicts a much smaller median redshift
(~ 0.5) and essentially no sources with z > 1. When the mid-infrared
counts are compared to K-band counts at the same energy
(
1. For
sources near the bump, the luminosity evolution model predicts a broad
redshift distribution, with a median at z ~
0.9 but extending with significant probability to redshifts > 2. In
contrast,
the pure density evolution model predicts a much smaller median redshift
(~ 0.5) and essentially no sources with z > 1. When the mid-infrared
counts are compared to K-band counts at the same energy
( S),
the mid-infrared sources contribute only about 10% of the energy at the
bright end, but more than 50% at S15µm
~ a few hundred µJy
(Elbaz et al 1999a).
Thus, the ISOCAM sources must represent an important subclass of the
optical/near-IR galaxies that are dusty and infrared active.
S),
the mid-infrared sources contribute only about 10% of the energy at the
bright end, but more than 50% at S15µm
~ a few hundred µJy
(Elbaz et al 1999a).
Thus, the ISOCAM sources must represent an important subclass of the
optical/near-IR galaxies that are dusty and infrared active.
The situation is less clear at 6.75 µm (Goldschmidt et al 1997, Taniguchi et al 1997a, Aussel et al 1999a, b, Sato et al 1999, Serjeant et al 1999, Flores et al 1999a). The stellar contamination is larger. The local luminosity function and template spectra appropriate for the galaxies are less well known than at 15 µm. The number of confidently detected sources is also much smaller. They are (more) compatible with a non-evolution (i.e. passive evolution) model with a significant contribution of ellipticals/S0s (E/SOs; Roche & Eales 1999). They are also consistent with the Pearson & Rowan-Robinson (1996) luminosity evolution model, but not with that of Franceschini et al (1994) (Serjeant et al 1999).