


As stated above, we have determined for all the galaxies (diam.
 1.0 kpc) in the survey
areas the separation from the central spiral
system and the position angle as measured from the direction of the
major axis of the system. It may be recollected that 14 survey: areas
with more than eight galaxies have been excluded; the remaining material
refers to 160 survey areas.
1.0 kpc) in the survey
areas the separation from the central spiral
system and the position angle as measured from the direction of the
major axis of the system. It may be recollected that 14 survey: areas
with more than eight galaxies have been excluded; the remaining material
refers to 160 survey areas.
The map in Fig. 3 gives the combined distribution over the survey area (radius = 50 kpc) of 218 physical and optical companions belonging to the 58 spiral systems of class A (edgewise orientation; no disturbance from the outside). The ellipse shows the average size and shape of the central galaxy, whereas the straight lines represent position angles of ± 30° . An examination of the figure indicates, quite unexpectedly, that the position-angle interval between -30° and +30° is under-represented, most of the companions being located in the remaining part of the area.
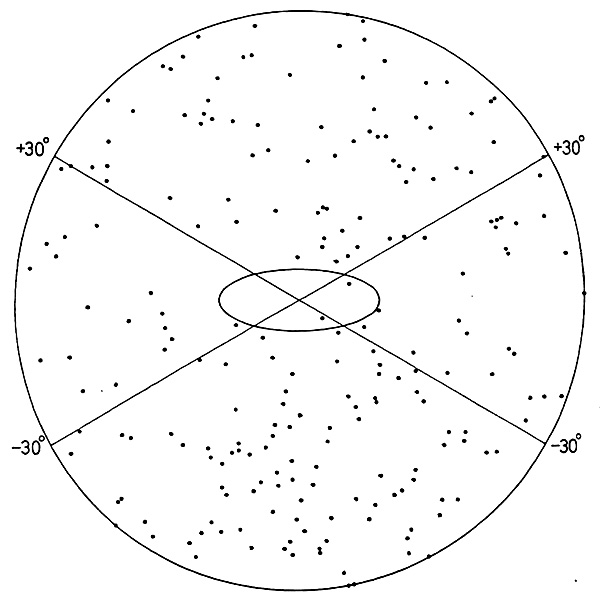 |
Figure 3. Combined distribution of 218 galaxies in 58 survey areas around spiral systems of class A (edgewise orientation). The ellipse shows the average size of the central system. |
The statistical distribution of the position angles, as derived from the
same material, is reproduced in Fig. 4 (upper
part); the frequencies refer to 15° intervals of the
position angle
 . The
broken line represents the distribution
corresponding to the optical companions alone, the position angles of
which are assumed to be distributed
at random. There are in all the comparison areas referring to the 58
class-A systems
a total of 300 galaxies; if this number is divided by 2 and multiplied
by 0.97 (cf.
sect. 5), we arrive at 242 optical
companions in each position-angle
class. The conclusion seems to be that all galaxies of the interval
0° -30° are optical companions,
the physical companions being concentrated in the interval
31° -90°. The total number of physical companions, in all
about 74, is represented by the area between the full distribution curve
and the broken line.
. The
broken line represents the distribution
corresponding to the optical companions alone, the position angles of
which are assumed to be distributed
at random. There are in all the comparison areas referring to the 58
class-A systems
a total of 300 galaxies; if this number is divided by 2 and multiplied
by 0.97 (cf.
sect. 5), we arrive at 242 optical
companions in each position-angle
class. The conclusion seems to be that all galaxies of the interval
0° -30° are optical companions,
the physical companions being concentrated in the interval
31° -90°. The total number of physical companions, in all
about 74, is represented by the area between the full distribution curve
and the broken line.
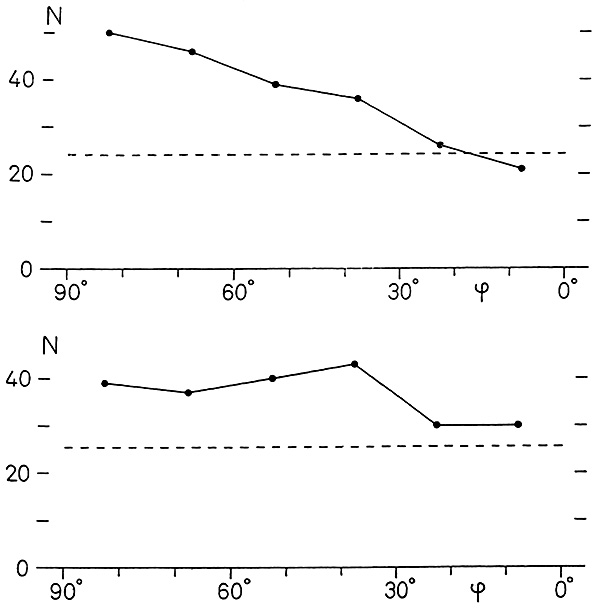 |
Figure 4. Statistical distributions of position angles of companions to spirals of class A (upper part), and spirals of class B (lower part). The broken lines refer to optical companions. |
On account of the peculiar distribution in position angle, we have, in determining the number of physical companions to individual spirals of class A (Table 7); included only those companions that have position angles larger than 30°. The comparison number referring to optical companions has been multiplied by 2/3 × 0.97 = 0.65.
The distribution of the position angles of 219 physical and optical companions belonging to the 57 spiral systems of class B (face-on orientation; no disturbance from the outside) is shown in the lower part of Fig. 4. Half the total number of optical companions, as found in the comparison areas, is now multiplied by 0.95 (cf. sect. 5); the resulting number of optical companions per position angle class is 25.6. In this case, the distribution referring to the physical companions deviates only to a small extent from a random one. The total number of physical companions is about 65.
Since the excess of large position angles found for satellites belonging
to spirals with an edgewise orientation may be an important feature, it
would be of interest if it
could be confirmed by material from other sources. A possibility for a
check is offered by the catalogues of galaxies, presumably complete down
to m = 15.5, published by Zwicky and collaborators
(1961,
1963,
1965,
1966,
1968).
From these lists we have
picked out all galaxies of types So-Sa-Sb-Sc outside the Virgo cluster
area that have apparent magnitudes m < 12.0 (types and
magnitudes from
Humason et al. 1956 and
Holmberg 1958),
and apparent diameter ratios b/a < 0.50 (diameters and
position angles of major axes from
Reinmuth 1926).
In circular survey areas with a radius of 30'
around these galaxies, in all 72 (areas with more than one galaxy
brighter than m = 12.0 being omitted), there are 140 companions
listed in the catalogues. An examination shows that the number of
companions with position angle
larger than
30° is
3.4 times the number corresponding to
= 0°
-30°.
If the radius of the areas is reduced to 15' the ratio is increased to
4.2. In both cases the number in the interval
= 0°
-30° closely agrees with the expected number of optical
companions. Although the
limiting magnitude is rather bright, and the number of physical
satellites correspondingly small, this simplified analysis thus confirms
the above result. It should be noted that the analysis is based on an
entirely different material.
The distribution of the position angles seems to indicate that nearby satellites of spiral systems avoid local latitudes below 30°. It may be noted that the same distribution is found for the satellites of the Milky Way and M31 (Table 1), the only exception being the very distant NGC 6822 (the M81 group is disturbed by the rather massive system M82). In the search for a possible explanation. it may first be pointed out that the surfaces of equal gravitational potential around a flattened spiral system are not spherical; it seems difficult, however, to estimate the resulting effect on the motions of the satellites. Secondly, many spirals are apparently surrounded by hydrogen clouds, which in the principal planes of the galaxies may extend far beyond the optical boundaries. The friction produced by the gas is perhaps sufficient to retard the motions of nearby satellites in low latitudes. If the gas clouds contain absorbing matter, which seems unlikely, some of the satellites may be obscured. On the other hand, the satellites are distributed in the way we should expect, if they are formed by matter ejected from the nuclear part of the spiral. In low latitudes, the ejection may be stopped by the gas located in the main body of the system; this seems to be the case in M82. The discussion on the origin of the satellites is continued in the next two sections.
The separations measured for all the galaxies (diam.
1.0 kpc) in
the survey areas
extend from a few kpc to 50 kpc. In Fig. 5, the
histogram gives the
statistical distribution of the separations of physical satellites from
spiral systems of classes A and B;
the total number is about 139. The broken line represents the
distribution of optical
companions, which is assumed to be a random one; according to the above
analysis,
the total number of these companions is about 250. The former
distribution is obtained if the numbers corresponding to the latter
distribution are subtracted from
the total numbers in the survey areas referring to the different
separation intervals.
 |
Figure 5. Statistical distributions of separations of physical companions (histogram) and optical companions (broken line) from the central spiral systems. |
It is quite apparent from the figure that it would not serve any useful purpose to try to extend. the survey work to separations above 50 kpc. Whereas for small separations the ratio of physical companions to all companions is quite favorable, it is reduced in the interval 41-50 kpc to 31%. For still larger separations the ratio would decrease rapidly, since the number of optical companions is steadily increasing; on the other hand, the distribution of physical companions may have a maximum at a separation of 40-50 kpc, as is indicated by a comparison of Fig. 5 with Fig. l. An extension of the work to larger separations is possible only if the diameter limit adopted for the galaxies, in the present case 1.0 kpc, is increased.
It may be of interest to mention that a study of the present material does not indicate any systematic dependence of the size of the satellites on the separation from the central galaxy. The separation interval is perhaps too limited to permit the determination of a possible correlation of this type.
The analyses of this and the two following sections do not include spiral systems of class C (disturbance from the outside), since the satellites of the primary galaxy may be mixed up with satellites belonging to other nearby galaxies.