


X-ray jets in a diverse collection of objects has become possible as a distinct field of research only with the 100-fold improvement in 2-dimensional imaging afforded by the 0.5" resolution of Chandra, compared to the previous 5" imaging of the Einstein and ROSAT observatories. Jets are studied in contexts as varied as the symbiotic binary R Aqr (Kellogg (2001)), the galactic black hole candidate XTE J1550-564 (Corbel 2002), plerions (discussed in Section 2), low power FR I sources where the X-ray emission is interpreted as an extension of the radio synchrotron emission (e.g., Worrall (2001)), and in powerful FR II galaxies and quasars. This section will consider only the last topic.
In Figure 8 I select some examples which illustrate the X-ray emission at the hotspots at the end of jets. In all these cases, from the radio observation of flux and spatial extent, plus the assumption of equipartition, one can conclude that the synchrotron photon density is the largest energy density in the X-ray emitting region. Thus the natural X-ray mechanism is synchrotron self-Compton (SSC) emission. The X-ray fluxes are generally consistent with magnetic fields in the range 70 to 320 µGauss, which are just a little below the equipartition field values (see refs. given in figure caption). This is a body of evidence that conditions near equipartition might be a reasonable assumption.
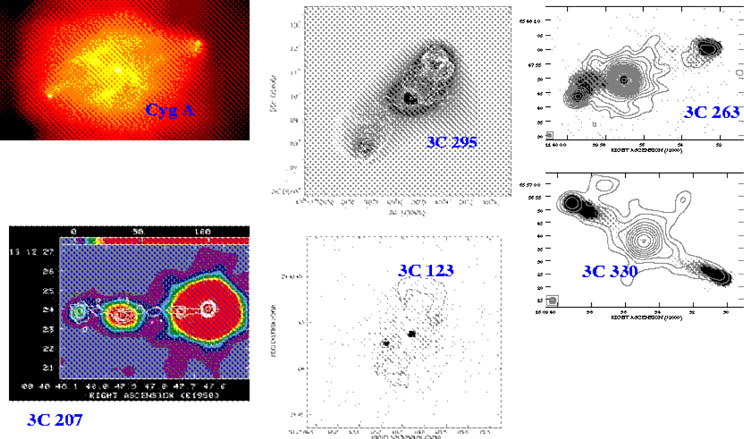 |
Figure 8. X-ray hotspots (false color and gray scale) at the end of radio jets (contours). Clockwise from upper left: Cygnus A (from Wilson (2000)), 3C 295 (from Harris (2000)), 3C 263 and 3C 330 from Hardcastle (2002)), 3C 123 (from Hardcastle (2001)), and 3C 207 (from Brunetti (2002)). hotspotsBM.ps |
Figure 9 shows some of the X-ray images of jets (in false color), overlaid with radio contours. These are samples from two surveys, one by Sambruna (2002), the other by Marshall (2002), (also reported in Schwartz (2003)). We also see the discovery image of PKS 0637-752 (Schwartz (2000), and a radio-optical-X-ray view of the jet in 3C 273 (Marshall (2001)). The X-ray emitting regions closely follow the radio in general, but the intensities sometimes correlate closely, as in the straight western jet of PKS 0637-752, and sometimes anticorrelate as in 3C 273. We will use the four PKS objects from our survey (bottom of Figure 9) to discuss the physical conditions in jets (Schwartz (2003b)).
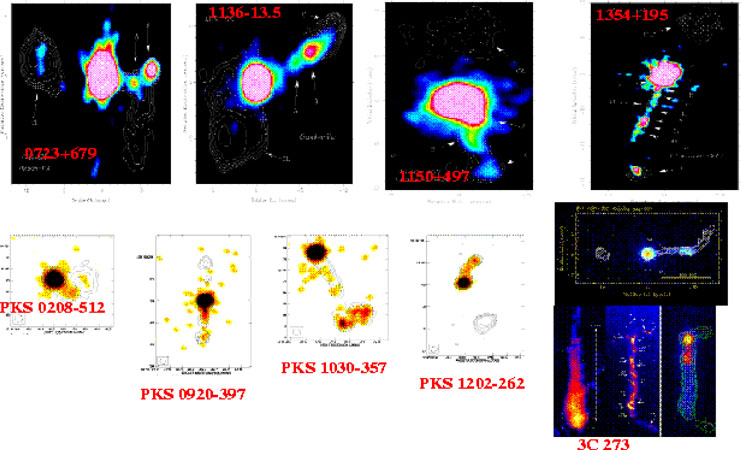 |
Figure 9. Chandra images of X-ray jets. Top panel from Sambruna (2002). Bottom: PKS objects from Schwartz (2003b); PKS 0637-752 from Schwartz (2000); 3C 273 from Marshall (2001). |
We have 8.64 GHz ATCA images of all our sources, and in some cases 4.8 GHz data. We smooth both the radio and X-ray to a 1.2" resolution, and superpose them by forcing coincidence of the quasar cores. We then divide the jets into distinct regions. This is somewhat subjective, guided by the features in the radio and X-ray emission. To label the different regions we use the term "knots" (K), with numbers increasing away from the quasar, but we don't intend this to prejudice the nature of the actual structure.
Figure 10 shows the spectral energy distributions we construct for each region. Optical upper limits from Magellan observations (J. Gelbord, private communication and in preparation 2004) directly show that for most cases the X-ray emission cannot be a simple extension of the radio synchrotron spectrum. For other regions, e.g., K3 of PKS 0208-512, the radio spectral shape would not connect to the X-ray region. For some other regions, e.g., K2 of PKS 0920-397 and K2 of PKS 0208-512 the X-ray emission could well result from a continuation of the relativistic electrons to high enough energy to emit X-ray synchrotron emission, as inferred for the first knot, A1, in 3C 273 (Marshall (2001)). The simplest X-ray emission mechanism, given the strong correlation with the radio, should invoke radiation from the same spectrum of relativistic electrons. This indicates some form of inverse Compton (IC) emission. From the size and radio emission, we know that SSC will not be important, and at 10's to 100's of kpc from the quasar the energy density of photons from the central black hole will not give significant radiation.
 |
Figure 10. Spectral energy distributions of regions within the X-ray jets. |
The most likely target photons for IC emission are the cosmic
microwave background (CMB). This was originally discussed by
Felten &
Morrison (1966)
in the context of explaining the cosmic X-ray
background. However, in the original case of PKS 0637-752, calculating
the equipartition magnetic field gave a result about 100 times larger
than the maximum magnetic field which would allow the X-rays to be
produced by IC/CMB radiation. The problem of requiring total energies
more than 103 times larger was resolved by
Tavecchio
(2000) and
Celotti (2001),
who considered the enhancement of the apparent CMB density by the factor
 2,
(Dermer &
Schlickeiser (1994)),
in a frame moving with bulk relativistic velocity
2,
(Dermer &
Schlickeiser (1994)),
in a frame moving with bulk relativistic velocity
 = (1 - 1 /
2)1/2 with
respect to the CMB frame. If one plots the required relativistic
beaming factor
= (1 - 1 /
2)1/2 with
respect to the CMB frame. If one plots the required relativistic
beaming factor  =
((1 -
cos
=
((1 -
cos ))-1
against the required rest frame magnetic field, then since
))-1
against the required rest frame magnetic field, then since
 BIC
and
1 /
Beq, one can always find a
solution for and B for
which the source is near equipartition
in its rest frame, and the same population of electrons produces radio
synchrotron radiation in the B field, and X-ray inverse Compton
radiation off the cosmic microwave background.
BIC
and
1 /
Beq, one can always find a
solution for and B for
which the source is near equipartition
in its rest frame, and the same population of electrons produces radio
synchrotron radiation in the B field, and X-ray inverse Compton
radiation off the cosmic microwave background.
We will continue by assuming all the jet emission is due to
IC/CMB. Figure 11 (left panel) shows the range
of Doppler factors,
 2 to 10, and
intrinsic magnetic fields, B
5 to 25
µG, for these objects
(Schwartz
(2003b)).
In this derivation, we have had to assume that
=
, since we do not have
independent information on the orientation of the jet. From
, we can infer a
maximum angle of the jet from our line of sight,
max =
cos-1[( - 1 /
) /
(2 -
1)1/2], which we use to
compute the minimum space distance (3 dimensions) of each region from
the central quasar. We estimate (right panel of
Figure 11) the kinetic flux of each element as
A2cU
(e.g.,
Ghisellini
& Celotti (2001)),
where A is the cross sectional area (and
we assume cylindrical symmetry), and U the total energy density in the
rest frame of the jet. We assume equipartition, with an equal energy
in protons and electrons, so that U = 3 B2 /
(8
2 to 10, and
intrinsic magnetic fields, B
5 to 25
µG, for these objects
(Schwartz
(2003b)).
In this derivation, we have had to assume that
=
, since we do not have
independent information on the orientation of the jet. From
, we can infer a
maximum angle of the jet from our line of sight,
max =
cos-1[( - 1 /
) /
(2 -
1)1/2], which we use to
compute the minimum space distance (3 dimensions) of each region from
the central quasar. We estimate (right panel of
Figure 11) the kinetic flux of each element as
A2cU
(e.g.,
Ghisellini
& Celotti (2001)),
where A is the cross sectional area (and
we assume cylindrical symmetry), and U the total energy density in the
rest frame of the jet. We assume equipartition, with an equal energy
in protons and electrons, so that U = 3 B2 /
(8  ). Under all
these assumptions, the lines
1/B are the lines of
constant kinetic flux, as shown in the left panel.
). Under all
these assumptions, the lines
1/B are the lines of
constant kinetic flux, as shown in the left panel.
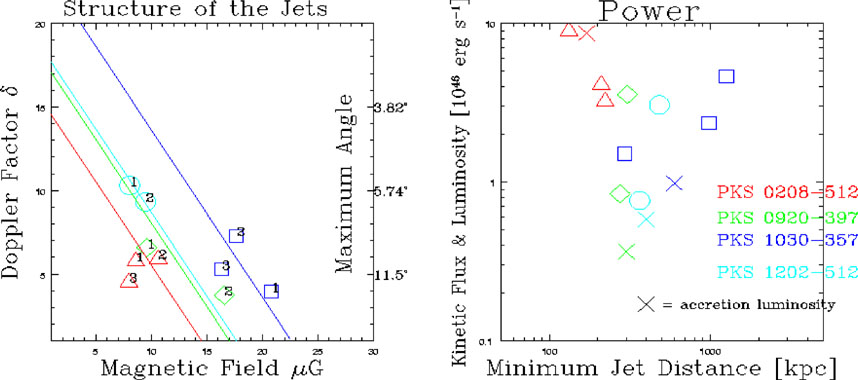 |
Figure 11. Structure of the X-ray jets. Left panel shows the Doppler factors and rest frame magnetic fields inferred for each region. Uncertainties are systematics dominated and about a factor of 2. Solid lines show the loci of constant kinetic flux. Right panel plots the kinetic flux through each region, vs. the minimum space distance of each component. Colored triangles, diamonds, circles and squares indicate the same source in each frame. Crosses plot the bolometric radiative luminosity of the quasar. |
In the right panel, the crosses plot the bolometric radiative luminosity of the quasar cores. We see that the kinetic flux in the jet is comparable to or greater than the accretion flux. This is consistent with the conclusion of Meier (2003) that accretion flow models must also consider jet production.
One of the most dramatic implications of the inference that we see IC/CMB X-radiation from radio jets is that any given object would appear to have a constant X-ray surface brightness even as it were displaced to an arbitrarily large redshift (Schwartz (2002)). This is because the energy density of the CMB increases as (1 + z)4, exactly offsetting the (1 + z)-4 cosmological diminution of surface brightness. Since the observed X-ray jet structures have length scales of 10's of kpc projected on the sky, they will be at least several arcsec long at redshifts greater than 2, and would easily be resolved by Chandra. In fact, all objects intrinsically similar to PKS 0637-752, or the outer knots of 3C 273, would be bright enough to already be detected by ROSAT, but would appear as point sources to the resolution of the PSPC all-sky survey.
Where are these bright X-ray jets at high redshifts? They could not be recognized as extended in the ROSAT all sky survey, so they would most likely be identified simply as part of the quasar core emission. If the quasar itself were not recognized, e.g., because it was too faint, the jet could be among the miscellaneous unidentified sources. Alternately, the jet could outshine the quasar in X-rays, and be cataloged at a position some distance away from the quasar, and again be a miscellaneous unidentified source.
Figure 12 shows a possible example of the last
case. In
this ROSAT HRI pointed observation, there was only a possible
3 detection of the
quasar GB 1713+2148
(Vignali (2003)).
There is an obvious stronger, point source about 1 arcmin to the NW
(left panel of Figure 12). When the NVSS 1.4
GHz image
(Condon (1998))
is superposed, we see the contours of the radio loud
quasar extending around this source
(Gurvits (2003)),
so that it is
clearly associated with the quasar, at a redshift z = 4.011
(Hook & McMahon
(1998)).
We still need a high resolution X-ray image to
ascertain if this is really an X-ray jet, or perhaps just a hotspot or
lobe.
detection of the
quasar GB 1713+2148
(Vignali (2003)).
There is an obvious stronger, point source about 1 arcmin to the NW
(left panel of Figure 12). When the NVSS 1.4
GHz image
(Condon (1998))
is superposed, we see the contours of the radio loud
quasar extending around this source
(Gurvits (2003)),
so that it is
clearly associated with the quasar, at a redshift z = 4.011
(Hook & McMahon
(1998)).
We still need a high resolution X-ray image to
ascertain if this is really an X-ray jet, or perhaps just a hotspot or
lobe.
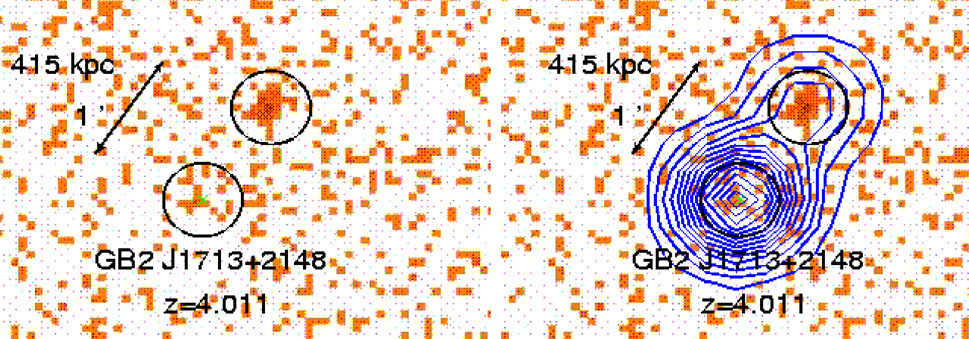 |
Figure 12. Left panel shows a ROSAT
HRI observation of the quasar GB 1713+2148 (green cross). The quasar is
at most a
3 |
Another case is due to
Siemiginowska (2003)
(Figure 13). Here the X-ray image (left panel)
is clearly extended,
and the analysis in the central panel shows that the data (solid line)
cannot be simulated simply by two point sources (dotted line).
Cheung (2003)
has analyzed archival VLA data, and found a
coincident jet at 1.4 GHz (right panel). An IC/CMB analysis shows
that this jet must be in relativistic motion, with a Doppler factor
 2.6 and a magnetic field
B
2.6 and a magnetic field
B  161µG, where the
uncertainty is largely due to the uncertain slope of the radio and
X-ray emission
(Siemiginowska (2003)).
161µG, where the
uncertainty is largely due to the uncertain slope of the radio and
X-ray emission
(Siemiginowska (2003)).
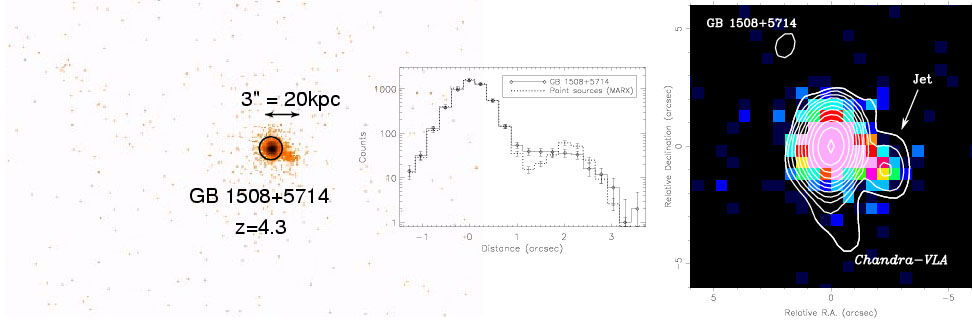 |
Figure 13. Left and center from Siemiginowska (2003): Chandra image binned in 0.15." pixels, clearly showing extent to the WSW of the quasar. The circle is 2.5" diameter, and contains 95% encircled power. The solid histogram is the intensity profile along the jet, which clearly cannot be simulated by two point sources (dotted histogram). Right: Cheung (2003) subsequently discovered a radio jet in archival 1.4 GHz VLA data. |