


Table 1 contains the final colors and magnitudes of the galaxies corrected for reddening and redshift. Many of the morphological types are from Sandage (1976). Values of log A / D(0) refer to the aperture size in units of the major diameter D(0) (RCBG). We first consider the variations of the different photometric indices within individual galaxies. This then permits discussion of the average galaxian colors within a standard projected aperture size. The reader should bear in mind the restricted nature of the sample of galaxies, particularly with regard to their absolute magnitude. Also, multiaperture observations such as those presented here are not ideal for a study of color gradients within galaxies. Since such gradients are expected to be in most cases, and since the accuracy of photometric measurements is never better than a couple of percent, the galaxies can be treated only in a statistical sense and not examined individually. A much better technique is to displace the measuring aperture from the center of the galaxy (e.g., Strom et al., 1976, 1977).
a) The Dependence of Color and CO Index on Radius
Figure 1 displays all the galaxy observations from Table 1 as a function of log A / D(0).
 |
Figure 1. All the corrected colors and CO indices from Table 1 are plotted as a function of log A / D(0). The linear least-squares fit to these data points is shown by the solid line and is discussed in the text. |
Table 3 presents least-squares solutions for radial color gradients found in two ways. First, linear fits (color versus log A / D(0)) were made to all of the data in Table 1 treated simultaneously; these fits are plotted in Figure 1. Second, slopes and errors were found for each galaxy individually, and then a weighted average was taken. Owing to the magnitude limited nature of the sample, selection effects could influence the first solution, and only the solutions on the right hand side of Table 3 have physical significance. As mentioned above, the 5 m V - K colors may contain a small systematic error. Although exclusion of these data does not produce a statistically significant change in the mean V - K gradient, the uncertainty in the gradient for this solution becomes as large as the gradient itself.
| All Points Solution (Fig. 1)
|
Average of Individual Radial Gradients
|
|||||||
| Color | N | Slope | ±
 m m |
r | N | Slope | ±
m |
±
e |
| CO | 120 | -0.002 | (0.01) | -0.05 | 33 | 0.00 | (0.01) | 0.02 |
| V-K | 120 | 0.00 | (0.03) | 0.00 | 32 | -0.11 | (0.04) | 0.05 |
| J-H | 148 | -0.04 | (0.01) | -0.34 | 37 | -0.08 | (0.01) | 0.04 |
| H-K | 148 | -0.04 | (0.01) | -0.43 | 37 | -0.04 | (0.01) | 0.03 |
| J-K | 148 | -0.07 | (0.01) | -0.48 | 37 | -0.12 | (0.02) | 0.04 |
The All Points Solution
on the left gives the slope
|
||||||||
Two important results from Table 3 are (1) the broad-band colors become bluer with increasing aperture size, and (2) there is no radial gradient in the CO index. The latter result differs from the tentative conclusion of Frogel et al. (1975b), as discussed in Section II f). The former result for the V - K color is consistent, to within the errors, with that of Frogel et al. (1975c). Note, however, that to within the errors, the mean radial change in V - K can be entirely accounted for by the change in J - K. The variances of the fits are consistent with the measuring errors for J - H, H - K, and CO, while for V - K it is about twice the estimated errors.
The dependence of V - K on aperture size is not well established by the data of this paper. At least part of the problem lies in the heterogeneous nature of the V data as mentioned above. Also, we cannot rule out a large dispersion in the V - K gradients of individual galaxies. The average J - K gradient (Table 3) is large, however, and would argue that any such dispersion would have to occur shortward of 1 µm.
Another estimate of the average dependence of V - K color on aperture size can be made by comparing V and K growth curves. Figure 2 displays the K growth curve obtained from the present data (see Section III (b), below). This curve was compared with a V growth curve constructed from data to be presented in Paper III. This latter curve is based on a homogeneous set of multiaperture observations made at CTIO of about 100 E and S0 galaxies. In terms of the distribution in absolute magnitude this sample is similar to the sample studied here. It differs, however, in consisting primarily of field galaxies. Such a comparison results in a change of V - K of -0.12 ± 0.03 for a change in A / D(0) from 0.1 to 1.0. This is consistent with the value in Table 3.
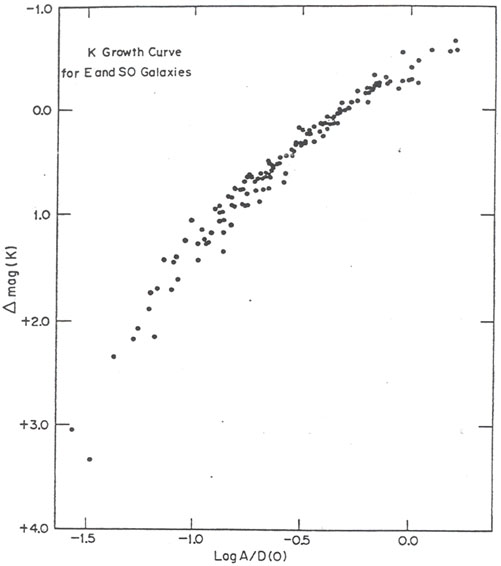 |
Figure 2. The K growth curve -based on the data of Table 1 and derived as discussed in the text. Normal points for the mean curve are given in Table 5. |
b) Integrated Properties of the Galaxies
In order to study the integrated properties of the galaxies, we assigned
to each galaxy representative values of the observed quantities,
corrected for reddening and redshift at a projected aperture size of
A / D(0) = 0.5. This value was chosen as it involves the least
extrapolation of the data.
The adopted values are contained in Table 4, and
were derived as follows:
for the CO index, any radial variations are masked by the measuring errors,
and a weighted average of all the CO observations for a given galaxy was
formed.
These are given in column (2) of Table 4. (Values
at 7".5 and 111" were excluded from the average because they
are available for only a few galaxies).
All observations of galaxies having K-magnitudes measured at both
A / D(0)
 0.5 were
combined into a preliminary growth curve. This curve
determined
0.5 were
combined into a preliminary growth curve. This curve
determined  K
between A / D(0) = 0.25 and 0.75 and allowed the
addition of nearly all the remaining galaxies. The data are presented in
Figure 2 and representative
values for the growth curve am given in Table 5.
Column (7) of Table 4 gives
K-magnitudes (K0.5) at
A / D(0) = 0.5 for the galaxies based either on
interpolation between observed points or extrapolation via the growth curve.
A similar procedure was followed to obtain
(J - K)0.5 and
(H - K)0.5. Values
of (V - K)0.5 in column (4) of
Table 4 were obtained either by interpolating
between the values given in Table 1
or in a few cases by extrapolating from
available V and K growth curves. The values
of (U - V)0.5 were taken from the sources used
for the V-magnitudes
or from Paper III. In a few cases it was necessary to extrapolate
available (U - V)
measurements to A / D(0) = 4.5 by use of the mean slope
(U -
V) /
log A / D(0) = - 0.13 (Paper III).
K
between A / D(0) = 0.25 and 0.75 and allowed the
addition of nearly all the remaining galaxies. The data are presented in
Figure 2 and representative
values for the growth curve am given in Table 5.
Column (7) of Table 4 gives
K-magnitudes (K0.5) at
A / D(0) = 0.5 for the galaxies based either on
interpolation between observed points or extrapolation via the growth curve.
A similar procedure was followed to obtain
(J - K)0.5 and
(H - K)0.5. Values
of (V - K)0.5 in column (4) of
Table 4 were obtained either by interpolating
between the values given in Table 1
or in a few cases by extrapolating from
available V and K growth curves. The values
of (U - V)0.5 were taken from the sources used
for the V-magnitudes
or from Paper III. In a few cases it was necessary to extrapolate
available (U - V)
measurements to A / D(0) = 4.5 by use of the mean slope
(U -
V) /
log A / D(0) = - 0.13 (Paper III).
| Values at A / D(0) = 0.5
|
Values at A / D(0) = 1.0
|
|||||||||
| Galaxy | CO | (U - V)0.5 | (V - K)0.5 | (J - K)0.5 | (H - K)0.5 | K0.5 | V1.0 | MV1.0 | MK1.0 | Notes |
| (1) | (2) | (3) | (4) | (5) | (6) | (7) | (8) | (9) | (10) | (11) |
| NGC 205 | 0.095 | 0.81 | 2.12 | 0.71 | 0.15 | 7.9 | 8.72 | -15.38 | -16.6 | 2, 5, 6 |
| NGC 221 | 0.155 | 1.31 | 3.14 | 0.87 | 0.21 | 5.50 | 8.16 | -15.94 | -19.02 | 1, 5 |
| NGC 404 | 0.11 | 1.03 | 2.60 | 0.78 | 0.13 | 8.44 | 10.44 | -13.66 | -16.08 | 2, 5, 6 |
| NGC 584 | 0.15 | 1.52 | 3.24 | 0.88 | 0.20 | 7.95 | 10.81 | -22.11 | -25.39 | 1 |
| NGC 596 | 0.145 | 1.43 | 3.14 | 0.80 | 0.16 | 8.65 | 11.42 | -21.50 | -24.69 | 1, 2, 6 |
| NGC 1023 | 0.16 | 1.46 | 3.15 | 0.88 | 0.22 | 6.72 | 9.44 | -21.06 | -24.20 | |
| NGC 1600 | 0.155 | 1.53 | 3.33 | 0.93 | 0.20 | 8.93 | 11.75 | -23.16 | -26.40 | 1 |
| NGC 1700 | 0.17 | 1.38 | 3.15 | 0.87 | 0.19 | 8.68 | 11.41 | -23.03 | -26.18 | 1 |
| NGC 2300 | 0.15 | 1.64 | 3.46 | 0.92 | 0.19 | 8.45 | 11.52 | -21.88 | -25.37 | 1 |
| NGC 2549 | 0.155 | 1.49 | 3.18 | 0.75 | 0.17 | 8.26 | 11.28 | -20.39 | -23.83 | |
| NGC 2634 | 0.14 | - | - | 0.89 | 0.20 | 9.92 | - | - | - | |
| NGC 2655 | 0.15 | - | - | 0.87 | 0.21 | 7.38 | 10.27 | -21.79 | -25.10 | |
| NGC 2672 | 0.16 | 1.53 | 3.22 | 0.90 | 0.21 | 9.25 | 12.10 | -22.42 | -25.69 | |
| NGC 2768 | 0.16 | 1.50 | 3.24 | 0.87 | 0.17 | 7.82 | 10.57 | -22.06 | -25.23 | 1 |
| NGC 2974 | 0.155 | 1.54 | 3.43 | 0.94 | 0.21 | 8.3 | 11.26 | -21.52 | -24.9 | 2,4,6 |
| NGC 3115 | 0.17 | 1.59 | 3.30 | 0.93 | 0.22 | 6.33 | 9.33 | -20.29 | -23.71 | 1 |
| NGC 3158 | 0.16 | 1.62 | 3.44 | 0.94 | 0.22 | 9.5 | 12.59 | -23.15 | -26.7 | 1, 2, 4, 6 |
| NGC 3193 | 0.165 | 1.46 | 3.16 | 0.65 | 0.18 | 8.53 | 11.24 | -20.66 | -23.79 | 1 |
| NGC 3226 | 0.14 | 1.48 | 3.32 | 0.89 | 0.21 | 9.17 | 11.85 | -20.05 | -23.15 | 4 |
| NGC 3377 | 0.17 | 1.22 | 3.02 | 0.85 | 0.19 | 7.99 | 10.68 | -20.20 | -23.31 | 6 |
| NGC 3379 | 0.155 | 1.63 | 3.36 | 0.87 | 0.19 | 6.97 | 9.87 | -21.01 | -24.33 | |
| NGC 3364 | 0.16 | 1.45 | 3.15 | 0.87 | 0.22 | 7.20 | 10.20 | -20.68 | -24.10 | 1, 6 |
| NGC 3607 | 0.165 | 1.52 | 3.36 | 0.90 | 0.21 | 7.70 | 10.64 | -20.97 | -24.33 | 1 |
| NGC 3608 | 0.145 | 1.48 | 3.24 | 0.90 | 0.20 | 8.73 | 11.45 | -20.16 | -23.30 | 1 |
| NGC 3613 | 0.155 | 1.47 | 3.15 | 0.83 | 0.17 | 8.55 | 11.19 | -21.68 | -24.74 | |
| NGC 3842 | 0.13 | - | - | - | - | - | - | - | - | 3 |
| NGC 3998 | 0.15 | 1.50 | 3.50 | 0.93 | 0.23 | 7.5 | 10.83 | -21.02 | -24.8 | 1, 2, 6 |
| NGC 4261 | 0.175 | 1.60 | 3.29 | 0.88 | 0.22 | 7.88 | 10.86 | -22.32 | -25.72 | |
| NGC 4278 | 0.165 | 1.45 | 3.29 | 0.86 | 0.20 | 7.68 | 10.62 | -20.73 | -24.09 | 1 |
| NGC 4283 | 0.18 | 1.37 | 3.22 | 0.90 | 0.23 | 9.56 | 12.50 | -18.85 | -22.21 | |
| NGC 4365 | 0.16 | 1.57 | 3.29 | 0.90 | 0.24 | 7.29 | 10.03 | -21.70 | -24.86 | 1 |
| NGC 4374 | 0.15 | 1.56 | 3.33 | 0.89 | 0.21 | 7.00 | 9.87 | -21.86 | -25.15 | 1 |
| NGC 4382 | 0.135 | 1.41 | 3.05 | 0.85 | 0.21 | 6.89 | 9.40 | -22.33 | -25.26 | 1 |
| NGC 4406 | 0.17 | 1.52 | 3.23 | 0.88 | 0.21 | 7.15 | 9.79 | -21.94 | -25.00 | 1 |
| NGC 4459 | 0.14 | 1.53 | 3.33 | 0.98 | 0.25 | 8.02 | 10.82 | -20.91 | -24.13 | 1, 6 |
| NGC 4464 | 0.145 | 1.41 | 3.09 | 0.86 | 0.16 | 9.91 | 12.79 | -18.94 | -22.24 | |
| NGC 4472 | 0.17 | 1.64 | 3.38 | 0.90 | 0.19 | 6.12 | 8.89 | -22.84 | -26.03 | 1 |
| NGC 4478 | 0.14 | 1.28 | 3.28 | 0.83 | 0.20 | 8.80 | 11.67 | -20.06 | -23.35 | 1 |
| NGC 4486 | 0.17 | 1.55 | 3.39 | 0.88 | 0.19 | 6.45 | 9.27 | -22.46 | -25.70 | 3 |
| NGC 4486A | 0.115 | - | - | - | - | - | - | - | - | |
| NGC 4486B | 0.10 | 1.62 | 3.6 | 0.88 | 0.17 | 10.49 | 13.66 | -18.07 | -21.66 | 1, 4 |
| NGC 4494 | 0.135 | 1.34 | 3.06 | 0.85 | 0.18 | 7.83 | 10.43 | -20.92 | -23.94 | 1, 2, 6 |
| NGC 4649 | 0.17 | 1.70 | 3.39 | 0.91 | 0.19 | 6.45 | 9.29 | -22.44 | -25.70 | |
| NGC 4889 | 0.17 | 1.0 | 3.31 | 0.92 | 0.23 | 9.29 | 12.08 | -23.54 | -26.75 | |
| NGC 5813 | 0.14 | 1.59 | 3.40 | 0.91 | 0.20 | 8.35 | 11.16 | -21.62 | -24.85 | 1 |
| NGC 5846 | 0.16 | 1.66 | 3.50 | 0.96 | 0.23 | 7.81 | 10.73 | -22.05 | -25.39 | 1 |
| NGC 5866 | 0.15 | 1.41 | 3.47 | 0.98 | 0.28 | 7.37 | 10.32 | -21.03 | -24.40 | |
| NGC 5982 | 0.155 | 1.49 | 3.21 | 0.85 | 0.20 | 8.83 | 11.62 | -22.18 | -25.39 | 1 |
| NGC 6702 | 0.21 | 1.46 | 3.35 | 0.96 | 0.24 | 9.97 | 13.0 | -22.01 | -25.5 | 1, 2, 6 |
| NGC 7619 | 0.17 | 1.73 | 3.49 | 0.90 | 0.20 | 8.80 | 11.70 | -22.68 | -26.00 | |
| NGC 7626 | 0.17 | 1.65 | 3.41 | 0.91 | 0.20 | 9.0 | 11.95 | -22.43 | -25.8 | 1, 2, 6 |
NOTES:
|
||||||||||
To obtain absolute magnitudes, we used values of V1.0 from the RCBG, with changes made when new data from the literature or Paper III were available. Mean redshifts corrected for solar motion relative to the Local Group of galaxies from the RCBG, and a Hubble constant of 50 km s-l Mpc-l was adopted. For those galaxies identified as being in small groups (de Vaucouleurs 1976), the mean redshift of the group was used; all galaxies considered to be in the Virgo cluster were assigned the same redshift. For Local Group members in the vicinity of M31 an M33, with NGC 404 included, a value of (m - M)0 = 24.1 was used (van den Bergh 1976). The absolute K-magnitudes MK1.0 were derived from (K0.5 - Kl.0) = 0.42 mag (Table 5).
| Log A/D(0) |
Mag (K) |
Log A/D(0) |
Mag (K) |
| -l. l. | +1.57 | -0.4 | +0.16 |
| -1.0 | +1.34 | -0.3 | 0.0 |
| -0.9 | +1.13 | -0.2 | -0.15 |
| -0.8 | +0.91 | -0.1 | -0.29 |
| -0.7 | +0.70 | 0.0 | -0.42 |
| -0.6 | +0.50 | +0.1 | -0.55 |
| -0.5 | +0.33 | ||
i) Color-Color Relationships
In Figures 3 - 5, we present the interrelationships between the CO index and the broad-band colors, and we list in Table 6 some least squares fits to the data points. The points for the globular clusters in these figures have not been included in the least squares solutions. These data will be discussed in Section IV below. Several basic results are apparent from Figures 3 and 4. First, the location of the points in a CO index versus color diagram reiterates our previous conclusion that the light of early-type galaxies is dominated by giant stars (Frogel et al. 1975a, b). Second, the CO index shows no significant dependence on color for the galaxies in this sample. In fact, with a few exceptions, the observed dispersion in the CO index is consistent with that expected from the measuring errors alone. Third, the average broad-band colors indicate a mean spectral type which depends on wavelength. This is the same effect noted by Stebbins and Whitford (1948); viz, the light of elliptical galaxies is of a composite nature, and as the observational baseline shifts to the red, we sample, in the mean, a later and later component of the stellar population. H - K, the reddest color, corresponds to that of an M star.
 |
Figure 3. The average CO index for a galaxy as a function of several colors determined at a characteristic value of A / D(0) = 0.5. All the data points from Table 4 are plotted. The dashed lines are the mean relationships for field giants and dwarfs from Appendix A. The circles represent the globular cluster observations from Table 2. The indicated spectral types refer to the mean giant relationship. |
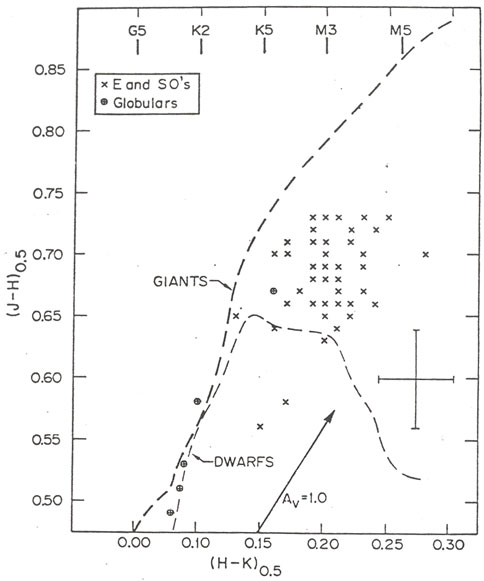 |
Figure 4. The J - H, H - K relation for the data from Table 4. The symbols are the same as in Fig. 3. |
In Figure 5 we plot V - K and J - K against U - V. The V - K color is strongly correlated with U - V, in agreement with the results of Strom et al. (1976). These correlations are discussed further below.
 |
Figure 5. All the galaxies from Table 4 are plotted. The open symbols represent the globular cluster data from Table 2. The solid lines are the linear least-squares fits to the galaxy data only. |
ii) Color - Absolute Magnitude Relationships
Figure 6 displays the colors and the CO index as functions of absolute magnitude; the least squares solutions from Table 6 are also shown. That a strong correlation exists between U - V and MV1.0 is well known (e.g., de Vaucouleurs 1961). The value for the slope agrees with that found from the data of Sandage (1972). As expected from Figure 5, V - K also correlates with MV1.0. The extinction vectors suggest that part of the scatter in Figure 6 could arise from uncertainties in the reddening. Any significant dependence of CO index on luminosity is not established by the present data.
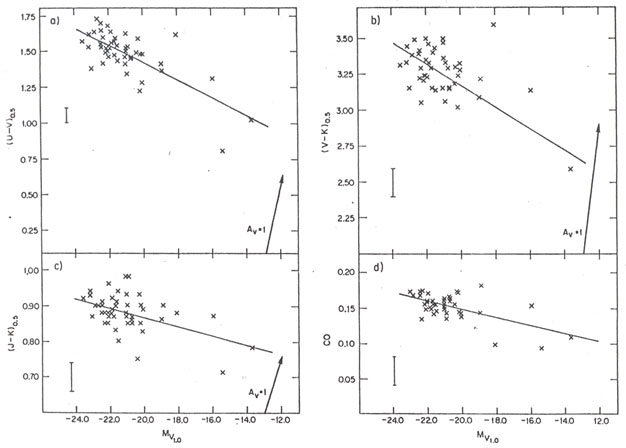 |
Figure 6. Corrected colors and CO indices for all galaxies from Table 4 are shown as functions of absolute magnitude. The linear least-squares fits are also indicated. |
In order to reduce the scatter in the color - absolute magnitude relationships, the observations of galaxies with well-determined distances (i.e., those in groups or clusters) were binned in unit absolute magnitude intervals (Table 7). This table shows evidence for the V - K color of the brightest galaxies to be relatively independent of luminosity compared to the fainter groups. A relative flattening in color - magnitude plots was first noted by Lasker (1970); this point is discussed further in Section VI (a) and in Paper III.
| X | Y | N | A(±
) |
B(±
) |
r | s |
| (U - V)0.5 | (V - K)0.5 | 47 | 1.35 (0.14) | +1.28 (0.09) | +0.89 | 0.11 |
| (U - V)0.5 | (J - K)0.5 | 47 | 0.57 (0.07) | +0.21 (0.05) | +0.65 | 0.04 |
| MV1.0 | (U - V)0.5 | 47 | 0.22 (0.32) | -0.06 (0.02) | -0.73 | 0.11 |
| MV1.0 | (V - K)0.5 | 47 | 1.69 (0.35) | -0.07 (0.02) | -0.09 | 0.19 |
| MV1.0 | (J - K)0.5 | 48 | 0. 60 (0.32) | -0.01 (0.02) | -0.51 | 0.05 |
| MV1.0 | CO* | 41 | 0.03 (0.34) | -0.006 (0.016) | -0.60 | 0.02 |
* Galaxies with
z  0.012 have been
excluded from the CO solution. s is the variance
of the fit. The assumed uncertainties in the quantities are
± 0.03,± 0.10,± 0.04,± 0.02, and ± 0.2 mag for
(U - V), (V - K), (J - K), CO and
MV1.0, respectively. 0.012 have been
excluded from the CO solution. s is the variance
of the fit. The assumed uncertainties in the quantities are
± 0.03,± 0.10,± 0.04,± 0.02, and ± 0.2 mag for
(U - V), (V - K), (J - K), CO and
MV1.0, respectively. |
||||||
| Mean Colors |
|||||||
| MV1.0 | No. | (U - V)0.5 | (V - J)0.5 | (V - K)0.5 | (J - H)0.5 | (H - K)0.5 | CO* |
| MV < - 22.8 | 3 | 1.57 | 2.44 | 3.36 | 0.70 | 0.22 | - |
-22.8  MV < - 21.8
 |
13 | 1.58 | 2.43 | 3.33 | 0.69 | 0.21 | 0.16 |
| -21.8
MV < - 20.8 |
10 | 1.50 | 2.40 | 3.30 | 0.68 | 0.22 | 0.15 |
| -20.8
MV < - 19.8 |
8 | 1.43 | 2.36 | 3.22 | 0.67 | 0.20 | 0.16 |
| -19.8
MV < - 18.8 |
3 | 1.39 | 2.27 | 3.15 | 0.68 | 0.20 | 0.14 |
| * Galaxies with
z 0.012 were excluded
from the average CO values. |
|||||||
iii) Ratios of Color Variations
An interesting result is found when changes in the colors within
galaxies are compared with changes
from galaxy-to-galaxy. Within individual galaxies, the average change in
U - V is given by
(U -
V)
/ log A
/ D(0) = - 0.13± 0.02, a result which is based
on the measurements of Paper III, and which agrees with that of
Sandage (1976).
We now combine this with the results of Tables 3
and 6 to arrive at the following values shown in
Table 8.
Taken at face value, these results show that if the 0.5 - 2.2
µm spectral region is divided in two, then radial changes of
the stellar population (due to luminosity
function and/or metallicity changes) within galaxies are most evident at
wavelengths longward of 1.2 µm. On the other hand,
from one galaxy to another such changes are evident primarily at
wavelengths shortward of 1.2 µm.
| Color Ratio | Within Galaxies | Between Galaxies |
| (V - K) / (U - V) |
0.9 ± 0.5 | 1.3 ± 0.1 |
| (J - K) / (U - V) |
0.9 ± 0.4 | 0.2 ± 0.1 |
| (V - J) / (U - V) |
0.0 ± 0.5 | 1.1 ± 0.2 |
The measurements made with the
J filter were subject to the largest corrections due to the beam
profile effects noted in Section II(c).
Since the average value of
log A /
D(0) for the determination
of (J -
K) /
log A /
D(0) is 0.6, any residual systematic
error in the J - K
color will be doubled. As an example, a systematic error of 0.02 mag would
change (J -
K) /
(U -
V) within galaxies by nearly 0.3. Another potential
difficulty with the interpretation of these numbers is that the slope
within
galaxies is determined mainly from observations of the brighter galaxies,
whereas the determination of the slopes between galaxies is weighted
toward the few galaxies of lower luminosity.
A proper resolution of the question of the color-color relationships within galaxies and between galaxies awaits detailed off-axis photometry, free of systematic beam profile effects.
The results presented above can be summarized as follows:
(1) In combination with the reddest broad-band colors, the CO data show that the infrared light. of the inner regions of early-type galaxies is dominated by the light of M giant stars.
(2) The strength of the CO absorption remains constant out to a projected aperture diameter A / D(0). A significant dependence of CO index on absolute magnitude is not established by the data.
(3) The observed dispersion in the UVJHK colors is clue, in part, to a dependence of the colors both on the fraction of the galaxy being measured on the galaxian luminosity. The sense of the dependences is for the colors to be redder near the nucleus and in galaxies of higher luminosity.
(4) There is evidence for differences in the ratios of color variations between galaxies and within galaxies.
It should be noted that the above conclusions are based on data from a sample of galaxies having a limited range in luminosity. Furthermore, averages have been taken over a sample which is inhomogeneous in several respects: a number of S0 galaxies, several local group dwarfs, and two possibly tidally stripped objects, NGC 221 and 4486B (Faber 1973a) have been included, and the galaxies are members of both rich and sparse groups. However, none of the correlations presented above are changed in a statistically significant way when various subsets of the data are excluded from the solutions. These points are explored in detail in Paper III, where a larger sample of galaxies is studied.