


For comparison purposes, we have listed in the last line of Table 1 the mean J - H and H - K colors for eight late-type spirals (Paper IV), and the K - L color for the nucleus of M31 (unpublished measurements). In Figure 2 we have plotted the K magnitude - aperture relations for the infrared peak in NGC 4631, for the Sd galaxy NGC 4490 (Paper IV), and for a standard bright elliptical (Paper I).
 |
Figure 2. The R magnitude growth curves are shown for the possible Sd galaxy NGC 4631, for the Sd galaxy NGC 4490 (Aaronson 1977), and for a standard elliptical galaxy (Frogel et al. 1977). Log A/D0 is the ratio of aperture size to corrected face-on diameter (from de Vaucouleurs, de Vaucouleurs, and Corwin 1976). The three curves have been shifted vertically an arbitrary amount, and an approximate flux-diameter relation is given next to each one. |
Several results are apparent from Table 1 and Figure 2. First, the K magnitude of point A, the most optically prominent part of the galaxy, is 0.8 mag fainter than that of the infrared peak, through identical measuring apertures. Second, all colors of NGC 4631 are considerably redder than the "mean spiral" colors. Third, a significant radial color variation is seen in the J - H and H - K nuclear colors; such a color gradient is characteristic of galaxies with nuclear 2.2 µm excesses (Paper IV). Finally, the magnitude aperture relation for NGC 4631 is similar to that of NGC 4490, and not to that of an elliptical galaxy.
If the "mean spiral" colors are adopted as the true colors of NGC 4631 corrected for inclination effect, the resulting color residuals cannot be fit by a single value of internal absorption, using the Van de Hulst reddening curve (Johnson 1968). For instance, the implied values of Av in the 21" aperture from E (J - H), E (H - K), and E (K - L) are 3.2 mag, 5.8 mag, and 15.2 mag, respectively. In particular, the excess at L indicates the presence of significant non-stellar emission. In this regard, the infrared peak in NGC 4631 is similar to the well known imbedded infrared sources in the galaxies NGC 253 (Becklin, Fomalont, and Neugebauer 1973), NGC 3034 (Kleinmann and Low 1970), and NGC 5128 (Becklin et al. 1971).
Assuming the J - H color excess is primarily due to
internal absorption (i.e.
Av  3), the remaining H - K and
K - L residuals can be fit if ~ 15% of the 2.2 µm flux is from
warm dust emission with temperature
T 700 K and
1 /
3), the remaining H - K and
K - L residuals can be fit if ~ 15% of the 2.2 µm flux is from
warm dust emission with temperature
T 700 K and
1 /  2
emissivity. Using a distance modulus of 30.15
(Sandage and Tammann
1975),
and a value of 1 for
2
emissivity. Using a distance modulus of 30.15
(Sandage and Tammann
1975),
and a value of 1 for
 a / Q (the ratio of grain
mass times grain radius to grain absorption efficiency),
the required mass of warm dust emitting in the 21" beam
is only
~ 20 M
a / Q (the ratio of grain
mass times grain radius to grain absorption efficiency),
the required mass of warm dust emitting in the 21" beam
is only
~ 20 M .
This value seems reasonable, for instance,
in relation to a dust mass of ~ 5 × 10⁴
M,
estimated by
Rees et al. (1969)
for the galaxy NGC 1068 on the basis
of the 2 - 20 µm spectrum. The red H - K color of point A,
which is probably an H II region on the foreground side of
the galaxy, implies that such a warm dust component, if
present, is not confined solely to the location of the
infrared peak. Observations of NGC 4631 at longer wavelengths
than L would clearly be of interest.
.
This value seems reasonable, for instance,
in relation to a dust mass of ~ 5 × 10⁴
M,
estimated by
Rees et al. (1969)
for the galaxy NGC 1068 on the basis
of the 2 - 20 µm spectrum. The red H - K color of point A,
which is probably an H II region on the foreground side of
the galaxy, implies that such a warm dust component, if
present, is not confined solely to the location of the
infrared peak. Observations of NGC 4631 at longer wavelengths
than L would clearly be of interest.
The center of the NGC 4631 rotation curve measured by G. and A. de Vaucouleurs (1963) lies about 80" west of point A (see their Figures 3 and 6). However, on the basis of the overall luminosity distribution, G. and A de Vaucouleurs placed the center of, their conjectured bar only about 40" west of point A, and cited an analogy with the Large Magellanic Cloud, where the center of the bar also appears to be displaced from the center of the velocity curve (de Vaucouleurs 1960; Feast, Thackeray, and Wesselink 1961). G. and A. de Vaucouleurs have interpreted the considerable scatter of points about their rotation curve as being due to streaming motions of gas from the ends of the bar, although this picture has been questioned on physical grounds by Burbidge, Burbidge, and Prenderghast (1964). In any event, the maximum negative residual velocity (i.e., motion toward the observer) of the scatter corresponds to a spot that is also about 40" west of point A (cf. Figure 6, G. and A. de Vaucouleurs 1963).
Pooley (1969) has presented high resolution continuum maps of NGC 4631 at 408 and 1407 MHz that indicate the presence of non-thermal radio emission from a narrow region corresponding roughly with the optical galaxian outline. Pooley further states that "the center of the brightest radio emission peak coincides closely with the position of the center of the rotation curve . . . but there are no features clearly related to the position of the bar . . ." However, careful inspection of Pooley's Plate I and Figure 1, and G. and A. de Vaucouleurs' Figure 6, reveals that Pooley has in fact misplotted the center of rotation adopted by the de Vaucouleurs': the position of peak radio emission given by Pooley lies about 50" west of point A, and not 80" west, the aforementioned location of the rotation curve center.
In Figure 3 we have plotted the position of peak infrared intensity, and of the rotation curve center, relative to the 1407 MHz map of Pooley (1969). It is clear that 1) the peak infrared and radio positions closely correspond; and 2) these peak positions are near the location predicted by G. and A. de Vaucouleurs (1963) to be the center of the end-on bar (which as discussed above is also the point of maximum negative velocity residual). Furthermore, it appears both from Figure 3 and the 2.2 µm scan shown in Figure 1 that the rotation curve center chosen. by the de Vaucouleurs' bears little physical relation to the galaxy itself.
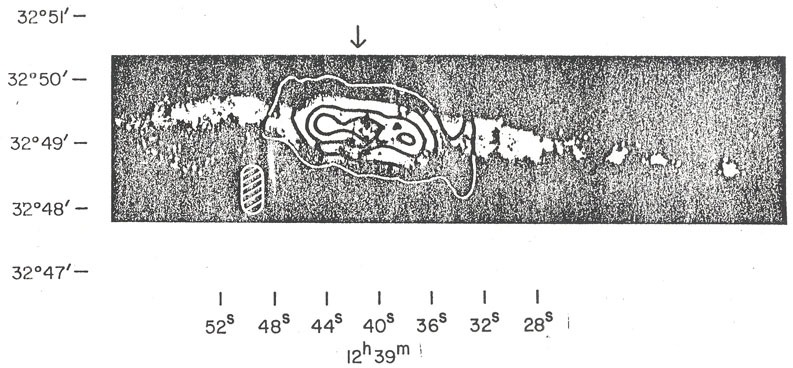 |
Figure 3. The 1407 MHz map of
Pooley (1970,
Plate I) is superimposed on an optical photograph of NGC 4631. The small
ellipse to the lower left is the beam size used by Pooley
The cross (+) is placed at the position of peak infrared
intensity; the triangle
( |
The K magnitude of the infrared peak was found to increase with aperture size in a manner- similar to that for the Sd galaxy NGC 4490 (Figure 2). Given also the proximity of the peak infrared intensity with both the peak radio intensity and the geometric center of the overall luminosity distribution, we conclude that the location of the infrared peak is probably the true position of the nucleus
We caution that the infrared measurements do not distinguish between a bar seen end-on, and a simple spherical nucleus. The data is consistent with the streaming model proposed by G. and A. de Vaucouleurs (1963), but does not confirm it - perhaps a high resolution 2 µm map might do so. However, in light of the observations presented in this paper, a reexamination of the NGC 4631 rotation curve does seem warranted.
We thank Bruce Carney, Mat Malkan, Steve Perrenod, and Bas van't Sant for their assistance at the telescope, Eric Persson and Herb Gursky for helpful discussions, and the Center for Astrophysics for generous financial support.
 ) marks the
rotation curve center adopted by
) marks the
rotation curve center adopted by
 )
lies at the right ascension predicted by.
those authors to be the true nuclear location.
)
lies at the right ascension predicted by.
those authors to be the true nuclear location.