


In recent years, high-energy
 -rays have
come to play an important role in the study of AGNs. Before the launch
of the CGRO in 1991, the only known extragalactic source of
high-energy
-rays
was 3C 273, which had been detected with the COS
B satellite 20 years ago
(Swanenburg et
al. 1978).
The EGRET detector on the CGRO has identified more than 65 AGNs
which emit
-rays
at energies above 100 MeV
(Hartman et al. 1999),
and a substantial fraction of those sources which remain unidentified in
the EGRET catalog are likely to be AGNs as well. In addition, the
Whipple Observatory
-ray
telescope has discovered three AGNs which emit at
energies above 300 GeV
(Punch et al. 1992;
Quinn et al. 1996;
Catanese et al. 1998),
and there are recent detections of two other AGNs with Cerenkov telescopes
(Chadwick et al. 1999;
Neshpor et al. 1998).
During flaring episodes, the
-ray
emission can greatly exceed the energy output of the AGNs at all other
wavelengths. Thus, any attempt to understand the physics of these
objects must include consideration of the
-ray emission.
-rays have
come to play an important role in the study of AGNs. Before the launch
of the CGRO in 1991, the only known extragalactic source of
high-energy
-rays
was 3C 273, which had been detected with the COS
B satellite 20 years ago
(Swanenburg et
al. 1978).
The EGRET detector on the CGRO has identified more than 65 AGNs
which emit
-rays
at energies above 100 MeV
(Hartman et al. 1999),
and a substantial fraction of those sources which remain unidentified in
the EGRET catalog are likely to be AGNs as well. In addition, the
Whipple Observatory
-ray
telescope has discovered three AGNs which emit at
energies above 300 GeV
(Punch et al. 1992;
Quinn et al. 1996;
Catanese et al. 1998),
and there are recent detections of two other AGNs with Cerenkov telescopes
(Chadwick et al. 1999;
Neshpor et al. 1998).
During flaring episodes, the
-ray
emission can greatly exceed the energy output of the AGNs at all other
wavelengths. Thus, any attempt to understand the physics of these
objects must include consideration of the
-ray emission.
All of the AGNs detected in high-energy
-rays are
radio-loud sources with the radio emission arising primarily from a core
region rather than from lobes. These types of AGNs are often
collectively referred to as "blazars" and include BL Lacertae (BL Lac)
objects, flat-spectrum radio-loud quasars (FSRQs), optically violent
variables, and superluminal sources. The emission characteristics of
blazars include high polarization at radio and optical wavelengths,
rapid variability at all wavelengths, and predominantly nonthermal
emission at most wavelengths. The emission from blazars is believed to
arise from relativistic jets oriented at small angles to our line of
sight. If so, the observed radiation will be strongly amplified by
relativistic beaming
(Blandford & Rees
1978).
Direct evidence for relativistic beaming of the radio emission comes
from very long baseline interferometer (VLBI) observations of apparent
superluminal motion in many blazars (e.g.,
Vermeulen & Cohen
1994).
The rapid variability and high luminosities of the detected
-ray
sources imply that the
-rays are
also beamed (see Section 4.1.3).
There is a growing consensus that blazars are all the same type of object, perhaps differing only in intrinsic luminosity (e.g., Fossati et al. 1998; Ghisellini et al. 1998) or some combination of luminosity and viewing angle (e.g., Georganopoulos & Marscher 1998). However, for this work we will continue the practice of referring to BL Lac objects and FSRQs as distinct objects: BL Lac objects are those blazars which have optical emission lines with equivalent width less than 5 Å, and FSRQs are the remaining blazars. As we will see, this distinction may be important in explaining why only BL Lac objects are detected at very high energies.
The spectral energy distribution of blazars appears to consist of two
parts. First, a low-energy component exhibits a power per decade
distribution that rises smoothly from radio wavelengths up to a broad
peak in the range spanning infrared (IR) to X-ray wavelengths, depending
on the specific blazar type, above which the power output rapidly drops
off. Second, a distinct, high-energy component, which does not extend
smoothly from the low-energy component, is often seen. It typically
becomes apparent in the X-ray range and has a peak power output in the
-ray range
between ~ 1 MeV and 1 TeV (e.g.,
von Montigny et
al. 1995),
again depending on the specific blazar type. When plotted as
E2 dN / dE (or equivalently
 F) the
spectral energy distribution shows a two-humped shape, although some
objects show evidence of a third component (e.g.,
Kubo et al. 1998).
F) the
spectral energy distribution shows a two-humped shape, although some
objects show evidence of a third component (e.g.,
Kubo et al. 1998).
Although there is no general consensus on the origin of these emission
components, it is generally agreed that the low-energy component arises
from incoherent synchrotron emission by relativistic electrons within
the jet (e.g.,
Blandford & Rees
1978).
This is supported most strongly by the high-level, variable polarization
observed in these objects at radio and optical wavelengths. The origin
of the high-energy emission is a matter of great interest. There are
many variations of the models, and here we only briefly mention a few
which are most often invoked to explain the
-ray
emission. The most popular models at this time are those in which the
-rays are
produced through inverse Compton scattering of low-energy photons by the
same electrons which produce the synchrotron emission at lower
energies. Synchrotron self-Compton (SSC) emission (e.g.,
Königl 1981;
Maraschi, Ghisellini,
& Celotti 1992;
Bloom & Marscher
1996),
in which the seed photons for the scattering are the synchrotron photons
already present in the jet, must occur at some level in all blazars, but
models in which the
-ray
emission arises predominantly from inverse Compton scattering of seed
photons which arise outside of the jet, either directly from an
accretion disk
(Dermer, Schlickeiser,
& Mastichiadis 1992)
or after being reprocessed in the broad-line region or scattering off
thermal plasma
(Sikora, Begelman,
& Rees 1994),
appear to fit the observations satisfactorily as
well. Another set of models proposes that the
-rays are
produced by proton-initiated cascades (e.g.,
Mannheim 1993).
As we will show in Section 4.1.3, the
-ray
observations strain both types of models but do not, at present, rule
any out.
In the remainder of this section we discuss the status of VHE observations and the emission characteristics of the detected objects (Section 4.1.1) and the results of multiwavelength campaigns on the detected objects (Section 4.1.2) which are the best probe of the physics of blazars, and finally we briefly discuss some of the implications of these observations on our understanding of the physics of the blazars and on the models which purport to explain them.
4.1.1. Observational Status and Emission Characteristics
The BL Lac object Mrk 421 (z = 0.031) was detected as the first
extragalactic source of VHE
-rays in
1992 using the Whipple Observatory
-ray
telescope
(Punch et al. 1992).
A two-dimensional image of the emission from Mrk 421 is shown in
Figure 6. Although Mrk 421 had previously been
part of an active program of observing extragalactic sources
(Cawley et al. 1985)
by the Whipple Collaboration, the observations which led to the
detection of Mrk 421 at TeV energies were initiated in response to the
detection of several AGNs by the EGRET experiment. The initial detection
indicated a 6
 excess, and the flux
above 500 GeV was approximately 30% of the flux of the Crab Nebula at those energies. Mrk 421 has been confirmed as a source of VHE
-rays by
the HEGRA Collaboration
(Petry et al. 1996),
the Telescope Array Project
(Aiso et al. 1997),
and the SHALON telescope
(Sinitsyna et
al. 1997),
and, as discussed in Section 4.1.2 below,
multiwavelength correlations have confirmed that the VHE source is
indeed Mrk 421 and not some other object.
excess, and the flux
above 500 GeV was approximately 30% of the flux of the Crab Nebula at those energies. Mrk 421 has been confirmed as a source of VHE
-rays by
the HEGRA Collaboration
(Petry et al. 1996),
the Telescope Array Project
(Aiso et al. 1997),
and the SHALON telescope
(Sinitsyna et
al. 1997),
and, as discussed in Section 4.1.2 below,
multiwavelength correlations have confirmed that the VHE source is
indeed Mrk 421 and not some other object.
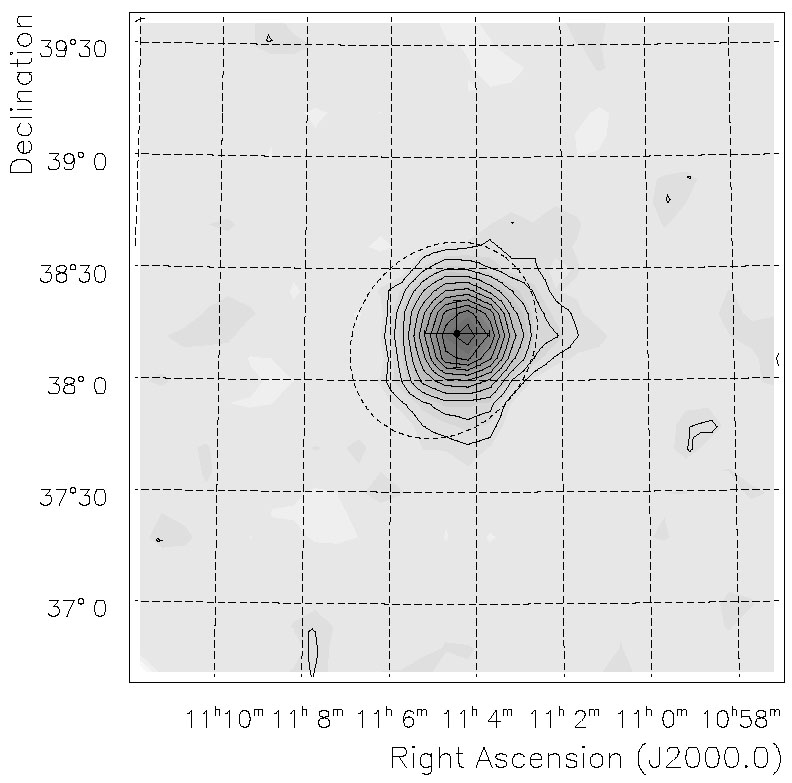 |
Figure 6. Two-dimensional plot of the VHE
|
With the successful detection of Mrk 421, the Whipple Collaboration
initiated a search for VHE emission from several other blazar-type AGNs,
concentrating at first on those objects detected by EGRET, but also
spending a substantial amount of time observing radio-loud blazars which
were not detected by EGRET. This broad approach led to the detection of
the BL Lac object Mrk 501 (z = 0.034) by the Whipple
Collaboration in 1995
(Quinn et al. 1996).
A two-dimensional map of the VHE emission from Mrk 501 is shown in
Figure 7. Because Mrk 501 had not been detected
as a significant source of
-rays by
EGRET, this was the first object to be discovered as a
-ray source
from the ground. Hence, VHE
-ray
astronomy was established as a legitimate channel of astronomical
investigations in its own right, not just an adjunct of high-energy
observations from space. The flux of Mrk 501 during 1995 was, on
average, 10% of the VHE flux of the Crab Nebula, making it the weakest
detected source of VHE
-rays.
Mrk 501 was confirmed as a source of VHE
-rays in
1996 by the HEGRA telescopes
(Bradbury et al. 1997)
the CAT telescope
(Punch 1997),
the Telescope Array Project
(Hayashida et al. 1998),
and TACTIC (Bhat 1997).
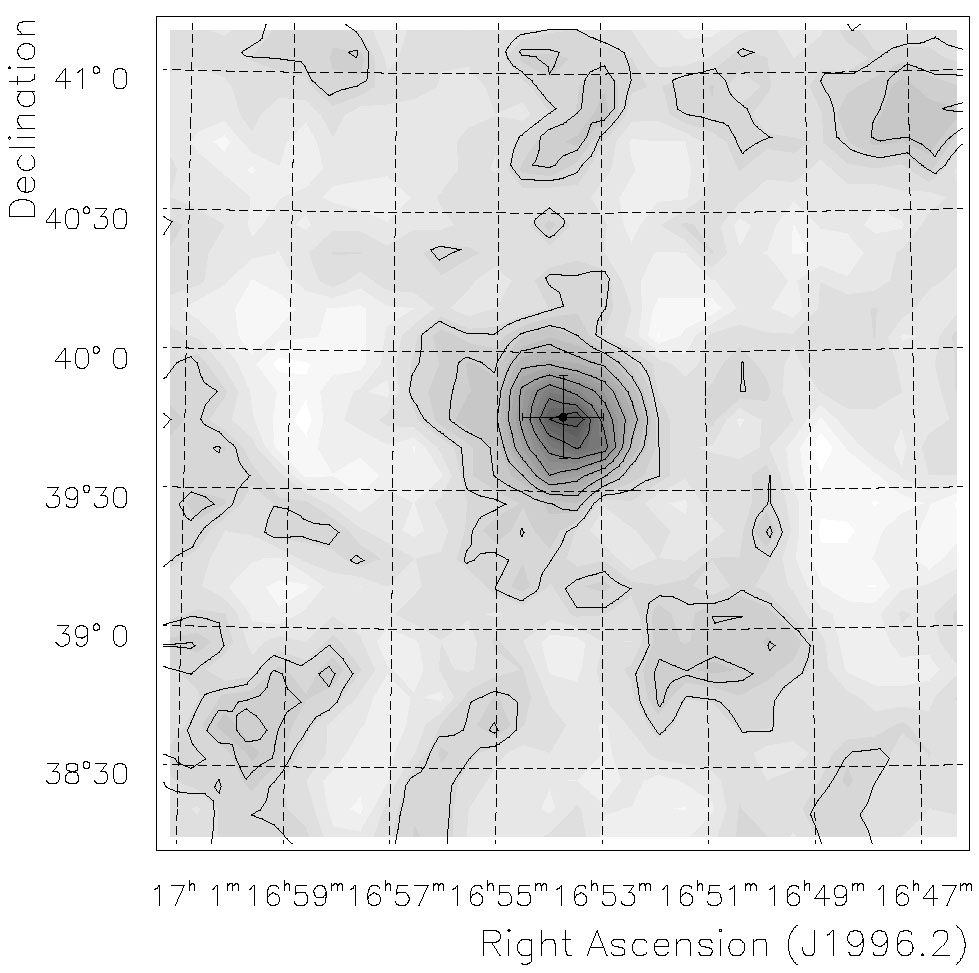 |
Figure 7. Two-dimensional plot of the VHE
|
In addition to the confirmed detections of Mrk 421 and Mrk 501, three
other objects have recently been reported as sources of VHE
-rays but
remain to be verified by detections from independent
-ray
telescopes. The BL Lac object 1ES 2344+514 (z = 0.044) was
detected at energies about 350 GeV by the Whipple Observatory in 1995
(Catanese et al. 1998).
Most of the emission comes from a single night, December 20, in which a
flux of approximately half that of the Crab Nebula was detected with a
significance of 6 .
Other observations during that year revealed an excess of 4
; subsequent
observations have yielded no significant signal. 1ES 2344+514 is not
detected by EGRET (D. J. Thompson & the EGRET Team 1996, private
communication), so if this detection is confirmed it is another instance
of a
-ray source
being first detected by a ground-based telescope. PKS 2155-304 (z
= 0.117), often considered the archetypical X-ray-selected BL Lac
object, was detected at energies above 300 GeV at the 7
level by combining
observations from 1996 and 1997 by the Durham group
(Chadwick et al. 1999).
The flux was approximately 40% of the VHE flux of the Crab Nebula and
corresponded to an active X-ray emission period. PKS 2155-304 is an
EGRET source with an average flux at E > 100 MeV comparable
to that of Mrk 421. Finally, the BL Lac object 3C 66A (z = 0.444)
has been reported as a source of above 900 GeV
-rays based
on a 5 excess seen in
observations in 1996 by
-ray
telescopes at the Crimean Astrophysical Observatory
(Neshpor et al. 1998).
The average flux during these observations was approximately 120% of the
flux of the Crab Nebula at these energies. 3C 66A is an EGRET source
(Hartman et al. 1999).
Extreme variability on timescales from minutes to years is the most
distinctive feature of the VHE emission from these BL Lac
objects. Variability in the emission is a surprising feature in some
respects because it implies a small emission region. If low-energy
photons (e.g., infrared, optical, and ultraviolet) are produced in the
same region, the VHE photons would pair produce with these photons and
would not escape. Also, if the variability occurs near the base of the
jet, there is likely to be considerable ambient radiation present which
can attenuate the
-ray
signal. This opacity problem is reduced considerably if the emission is
beamed toward us (e.g.,
Dermer & Gehrels
1995;
Buckley et al. 1996),
and this has been one of the main arguments for
-ray
beaming in these objects (see Section 4.1.3).
The first clear detection of flaring activity in the VHE emission of an AGN came in 1994 observations of Mrk 421 by the Whipple Collaboration (Kerrick et al. 1995a), where a 10-fold increase in the flux, from an average level that year of approximately 15% of the Crab flux to approximately 150% of the Crab flux, was observed. Subsequent analysis of Mrk 421 data indicated evidence for less prominent episodes of variability during 1992 and 1993 as well (Schubnell et al. 1996). This suggested that variability could be present on a fairly frequent basis in the VHE emission. In order to characterize this variability, the Whipple Collaboration began systematic monitoring of Mrk 421 in 1995 which continues to the present day. The observations of Mrk 421 in 1995, shown in Figure 8, revealed several distinct episodes of flaring activity, as in previous observations but, perhaps more importantly, indicated that the VHE emission from Mrk 421 was best characterized by a succession of day-scale or shorter flares with a baseline emission level below the sensitivity limit of the Whipple detector (Buckley et al. 1996). The timescale of the flaring is derived from the fact that, for the most part, the flux levels measured each night varied fairly randomly with no evidence of a smooth pattern. Thus, although no significant intranight variability was discerned in these observations, it seemed clear that it could occur.
 |
Figure 8. Daily VHE
|
The hypothesis that the VHE emission of Mrk 421 could flare on subday
timescales was borne out in spectacular fashion in 1996, with the
observations of two flares by the Whipple Collaboration
(Fig. 9;
Gaidos et al. 1996).
In the first flare, observed on May 7, the flux increased monotonically
during the course of ~ 2 hours of observations, beginning at a rate
twice as high as any previously observed flare and reaching a counting
rate
 10 times the rate
from the Crab, at which point observations had to stop because of
moonrise. This flux is the highest observed from any VHE source to
date. The doubling time of the flare was ~ 1 hour. Follow-up
observations on May 8 showed that the flux had dropped to a flux level
of 30% of the
Crab Nebula flux, implying a decay timescale of less
than 1 day. The second
flare, observed on May 15, although weaker, was remarkable for its very
short duration: the entire flare lasted approximately 30 minutes with a
doubling and decay time of less than 15 minutes. These two flares are
the fastest timescale variability, by far, seen from any blazar at any
-ray
energy.
10 times the rate
from the Crab, at which point observations had to stop because of
moonrise. This flux is the highest observed from any VHE source to
date. The doubling time of the flare was ~ 1 hour. Follow-up
observations on May 8 showed that the flux had dropped to a flux level
of 30% of the
Crab Nebula flux, implying a decay timescale of less
than 1 day. The second
flare, observed on May 15, although weaker, was remarkable for its very
short duration: the entire flare lasted approximately 30 minutes with a
doubling and decay time of less than 15 minutes. These two flares are
the fastest timescale variability, by far, seen from any blazar at any
-ray
energy.
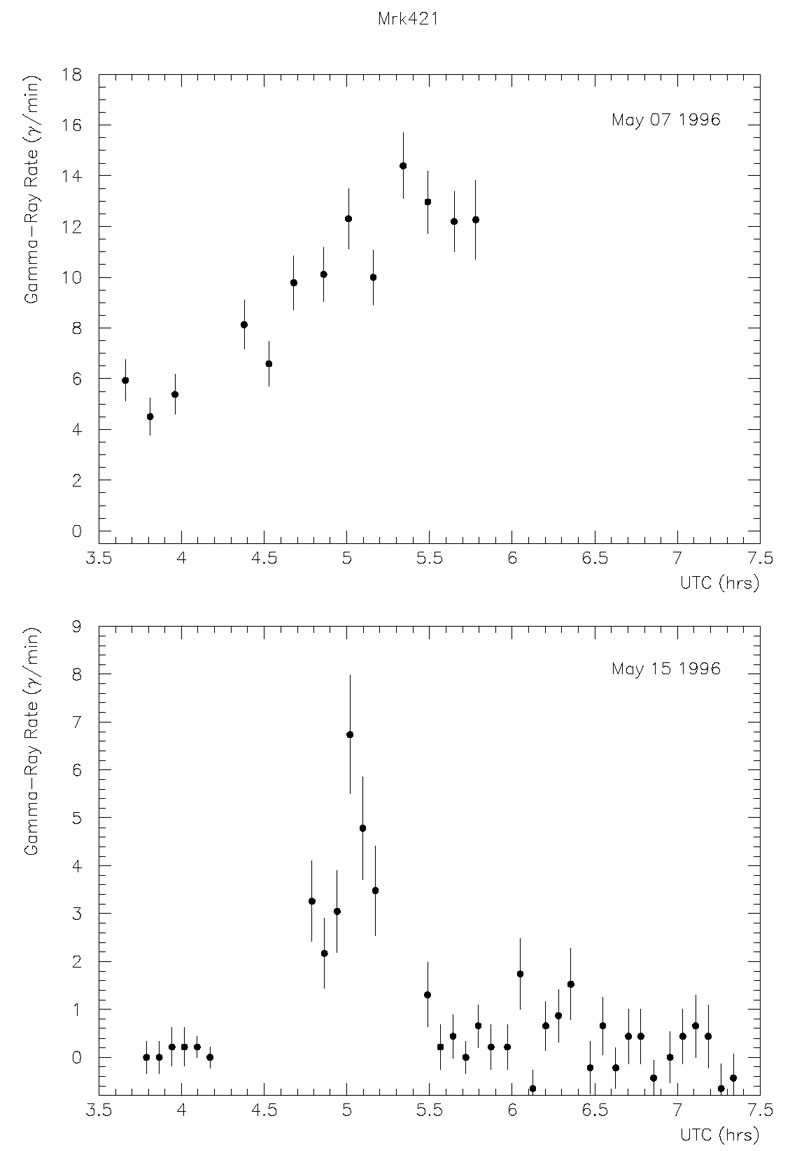 |
Figure 9. Light curves of two flares observed from Mrk 421 by the Whipple Collaboration on (a) 1996 May 7 and (b) May 15. The time axes are shown in coordinated universal time (UTC) in hours. For the May 7 flare, each point is a 9 minute integration; for the May 15 flare, the integration time is 4.5 minutes. Figure from Gaidos et al. (1996). |
Systematic observations of Mrk 501 sensitive to day-scale flares have
been conducted since 1995 with the Whipple Observatory
-ray
telescope
(Quinn et al. 1999)
and since 1997 with the telescopes of the HEGRA
(Aharonian et al. 1999a),
CAT (Punch 1997),
and Telescope Array
(Hayashida et al. 1998)
collaborations. The results of these observations indicate a wide range
of emission levels
(Fig. 10) and some very interesting
similarities and differences with the VHE emission from Mrk 421. The
observations in 1995 indicate a flux which is constant, with the
exception of one night, MJD 49,920, when the flux was approximately 4.6
above the average
(approximately 5 times the flux during the remainder of the season)
(Quinn et al. 1996,
1999).
Observations in 1996 by the Whipple Observatory show that the average
flux of Mrk 501 had increased to approximately 20% of the
Crab Nebula
flux above 300 GeV, indicating a twofold increase in the average flux
over the 1995 observations
(Quinn et al. 1999).
HEGRA observations indicated an average flux of approximately 30% of the
Crab flux above 1.5 TeV, perhaps indicating a harder
emission spectrum than that of the Crab Nebula. The Whipple observations show no clear
flaring episodes, but the probability that the average monthly flux
levels are drawn from a distribution with a constant flux level is 3.6
× 10-5, clearly indicating that the emission is varying
on at least month scales
(Quinn et al. 1999).
There is no significant
evidence for day-scale variations within each month in 1996.
 |
Figure 10. VHE
|
In 1997, the VHE emission from Mrk 501 changed dramatically. After being the weakest known source in the VHE sky in 1995 and 1996, it became the brightest, with an average flux greater than that of the Crab Nebula (whereas previous observations had never revealed a flux greater than 50% of the Crab flux). Also, the amount of day-scale flaring increased and, for the first time, significant hour-scale variations were seen. Two clear episodes of hour-scale variability were detected with the Whipple Observatory telescope (Fig. 11), and a search for intraday variability revealed several other nights which, considered alone, would not have been considered significant but, when combined, indicated frequent intraday variability which was just below the sensitivity of the Whipple Telescope (Quinn et al. 1999). Analysis of data from the HEGRA (Aharonian et al. 1999a) and Telescope Array (Hayashida et al. 1998) projects revealed no statistically significant intranight variations, but the two nights in the HEGRA data with the smallest statistical probability of having constant emission are the same nights seen to have significant variability in the Whipple data.
 |
Figure 11. Very high energy
|
Perhaps the most important aspect of the observations of Mrk 501 in 1997 was that, for the first time, Cerenkov telescopes other than the Whipple Telescope consistently detected a significant excess from Mrk 501 on a nightly timescale. This permitted more complete VHE light curves to be obtained (which it is expected will eventually lead to a better understanding of the VHE emission from blazars) and also provided confirmation that different VHE telescopes could obtain consistent results from a variable source (see Fig. 12).
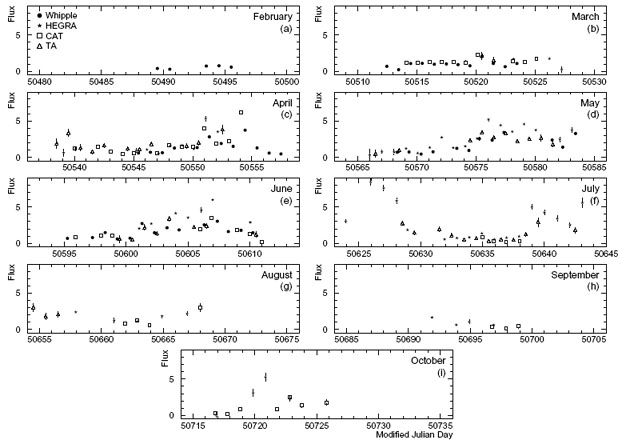 |
Figure 12. Very high energy
|
In addition to the establishment of the flaring itself, the Telescope Array Collaboration performed a periodicity search with their VHE observations of Mrk 501 in 1997 (Hayashida et al. 1998). They show evidence for a quasi-periodic signal in the data which has a period of approximately 12.7 days. This is disturbingly close to half the lunar cycle. If real, this would be an extraordinary result, given the very short timescale of the quasi-periodicity.
The only published results on observations of Mrk 501 in 1998 are those of the Whipple Observatory (Quinn et al. 1999). The average emission level was approximately 30% of the Crab flux, but there was considerably more variability in the emission than in 1996 or 1995. Two distinct, very high flux flares were observed, one with the highest flux (approximately 5 times the Crab flux) ever observed from Mrk 501 with the Whipple Telescope. The monthly average flux was also variable, with 3 months showing emission levels similar to the 1995 flux, approximately 10% of the Crab Nebula.
A natural question to ask about the variability in Mrk 501 is whether the degree of variability seen changes as a function of the mean flux level, that is, whether Mrk 501 is really more variable when its average flux is higher or whether it is an artifact of the telescopes being more sensitive to variations when the average flux is higher. To test this, Quinn et al. (1999) performed simulations to see if the day-scale variability observed with the Whipple Telescope in 1997 (when the average VHE flux was 1.3 times that of the Crab) would have been detectable in 1996 and 1995 (when the average VHE flux was 20% and 10% that of the Crab, respectively) and also tested whether the month-scale variations in 1997 and 1996 would have been detectable in 1995. Their simulations indicate that the day-scale flaring in 1997 would have been detectable in the 1996 data, but not the 1995 data, and the month-scale variations in 1996 would have been detectable in 1995, while the 1997 month-scale variations would not have been detectable. Thus, it appears that the higher state emission levels have different variability characteristics than the lower emission levels.
The other unconfirmed sources are, if they are indeed sources, also
variable emitters of VHE
-rays.
1ES 2344+514 was only detected with high statistical
significance on one night, but has never been detected since, with flux
limits of approximately 10% of the Crab flux
(Catanese et al. 1998;
Aharonian et al. 1999b).
PKS 2155-304 has also been claimed to be variable
(Chadwick et al. 1999),
although the statistical probability that the emission is constant is
not quoted. Finally, 3C 66A must be variable, or else observations with
the Whipple Observatory telescope
(Kerrick et al. 1995b)
and the HEGRA telescope
(Aharonian et al. 1999b)
would have easily detected this object at the flux level quoted by the
Crimean group.
The high-flux VHE emission from Mrk 421 and Mrk 501 has permitted
detailed spectra to be extracted. Accurate measurements of the VHE
spectrum are important for a variety of reasons. First, the shape of the
high-energy spectrum is a key input parameter of AGN emission models,
particularly as it relates to the MeV-GeV measurements by EGRET. Second,
how the spectrum varies with flux, compared with longer wavelength
observations, provides further emission model tests. Third, spectral
features, such as breaks or cutoffs, can indicate changes in the primary
particle distribution or absorption of the
-rays via
pair production with low-energy photons at the source or in
intergalactic space (see Section 4.2).
For Mrk 421, the only detailed spectra published at this time come from
observations of high-state emission with the Whipple Observatory
telescope
(Fig. 13;
Zweerink et al. 1997;
Krennrich et al. 1999).
Analysis of the spectra obtained from observations of flares on 1996 May
7 and 15 and observations of high-state emission taken at large zenith
angles in 1995 June indicate that, within the statistical uncertainties,
the spectra are all consistent with a simple power-law spectrum:
dN / dE  E-2.5
(Krennrich et al. 1999).
When combined, these three data sets are consistent with a simple
power-law spectrum for Mrk 421 of the form
(Krennrich et al. 1999)
E-2.5
(Krennrich et al. 1999).
When combined, these three data sets are consistent with a simple
power-law spectrum for Mrk 421 of the form
(Krennrich et al. 1999)
 |
where E is in units of TeV.
 |
Figure 13. VHE
|
Observations of Mrk 421 in 1997 and 1998 with the HEGRA system of Cerenkov telescopes reveal a significantly different spectrum (Aharonian et al. 1999c),
 |
than observed with the Whipple Telescope. The emission level for the HEGRA observations was approximately 0.5 times the Crab flux, much lower than the fluxes (1-10 times the Crab flux) used in the Whipple observations. This may indicate that the spectrum in Mrk 421 becomes softer with decreasing flux. However, HEGRA observations show no evidence of variability between observations at fluxes above the Crab flux and those between one-sixth and one-half the Crab flux, and the Whipple results show no variations in spectral index despite using observations spanning a 10-fold range of fluxes. Further studies may help resolve these differences.
As with the studies of the variability of its VHE flux, the high-state emission detected from Mrk 501 in 1997 allowed detailed spectra to be derived by several experiments, permitting studies of the time dependence of the spectra and providing all-important cross-checks of the methods used to derive energy spectra. Because of the rapid variability of the emission, again the normalization of the spectra are not of fundamental importance, except perhaps in the context of multiwavelength studies which are discussed in Section 4.1.2 below.
The most detailed energy spectra published at this time come from
Whipple observations between 250 GeV and 12 TeV
(Samuelson et al. 1998;
Krennrich et al. 1999)
and HEGRA data spanning 500 GeV-20 TeV
(Aharonian et al. 1999b).
The Telescope Array Collaboration has also derived a spectrum over a
slightly narrower energy range (600 GeV-6.5 TeV)
(Hayashida et al. 1998).
A search for variability in the spectrum revealed no significant changes
in spectrum with flux or time
(Samuelson 1999;
Aharonian et al. 1999a),
allowing large data sets to be combined to derive very detailed energy
spectra spanning large ranges in energy. The spectra derived by Whipple
and HEGRA deviate significantly from a simple power law. For Whipple,
the  2 probability
that a power law is consistent with the measured spectrum is 2.5 ×
10-7. This is the first significant deviation from a power
law seen in any VHE
-ray source
and any blazar at energies above 10 MeV. The Whipple spectrum is
2 probability
that a power law is consistent with the measured spectrum is 2.5 ×
10-7. This is the first significant deviation from a power
law seen in any VHE
-ray source
and any blazar at energies above 10 MeV. The Whipple spectrum is
 |
and the HEGRA spectrum is
 |
where E is in units of TeV. The form of the curvature term in the
spectra has no physical significance as the energy resolution of the
experiments is not sufficient to resolve particular spectral models. The
Whipple spectral form is simply a polynomial expansion in log E
versus log(dN / dE) space. The HEGRA form was chosen
presumably because attenuation of the VHE
-rays by
pair production with background IR photons could produce an exponential
cutoff. In fact, the Whipple and HEGRA data are completely consistent
with each other, as shown in Figure 14. The
Telescope Array Collaboration derived a spectrum which is well fitted by
a simple power law (dN / dE
E-2.5±0.1). The data from this spectrum are also
consistent with the Whipple and HEGRA spectra.
 |
Figure 14. The energy spectrum of Mrk 501 as measured by the HEGRA array (filled circles) and the Whipple Telescope (open circles). The dashed line indicates the power law plus exponential cutoff spectrum fit to the HEGRA data. Figure from Konopelko (1999). |
4.1.2. Multiwavelength Observations
Some of the most exciting results on VHE
-ray
sources have come through observations where several telescopes
operating at different wavelengths simultaneously monitor the activity
in a blazar. These multiwavelength campaigns have involved the larger
astronomical community in the study of VHE sources and served the
subsidiary purpose of confirming the source identifications of the VHE
-ray-emitting blazars.
The first evidence of correlated variability between VHE
-rays and
lower energy emission came from a multiwavelength campaign on Mrk 421 in
1994 April/May (Macomb et al.
1995,
1996).
Observations were conducted with the Whipple Telescope, EGRET,
ASCA in X-rays, the International Ultraviolet Explorer
(IUE), the United Kingdom Infrared Telescope (UKIRT), the James
Clerk Maxwell Telescope (JCMT) in the millimeter wave band, and the
University of Michigan 26 m radio telescope (UMRAO) in the 4.8-14.5 GHz
frequency range. The VHE
-ray,
ASCA, and EGRET observations are shown in
Figure 15. The VHE observations reveal the
rising edge of a flare that developed over approximately 4 days with the
peak flux detected on May 15 (UT) being approximately 9 times the mean
flux measured during that observing season and approximately 1.4 times
the flux of the Crab Nebula. Observations had to be halted after May 15
because the phase of the Moon precluded further
observations. Observations taken with ASCA on May 16/17
(Takahashi et al.
1994,
1996)
indicated a flux approximately 20 times the quiescent X-ray flux of
Mrk 421, and the time coincidence between the two
observations of
unprecedented high states is the basis for the claim of a correlation in
this campaign. Interestingly, EGRET observations taken between 1997 May
10 and 17 did not detect the strong day-scale variability seen in VHE
-rays. The
average flux during this period was approximately twice the average flux
measured in 1994 April, so there is some evidence of a higher emission
state, but it is not significant enough to claim a correlation. The
observations at UV, IR, millimeter, and radio wavelengths showed no
evidence of variability during this period. Because of the offset in
time of the observations between the VHE
-rays and
the X-rays, detailed comparisons of the variability in those wave bands
are not possible.
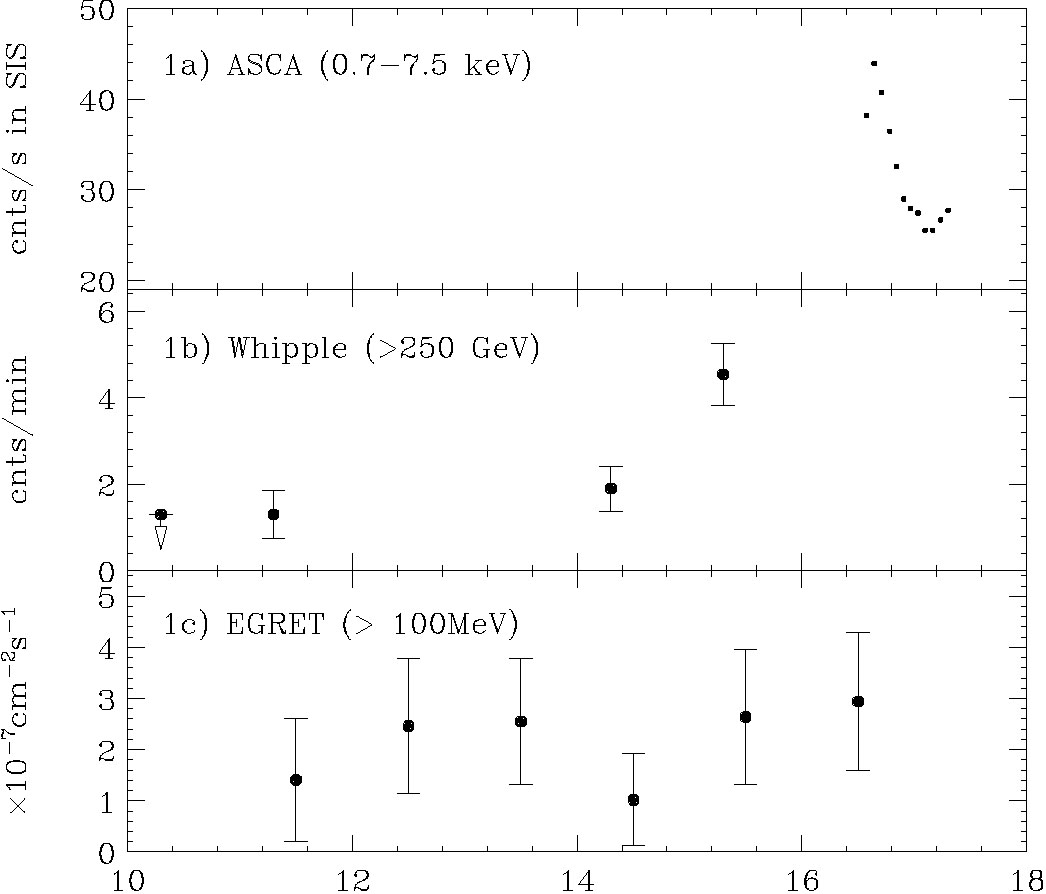 |
Figure 15. Light curves for observations of Mrk 421 in 1994 May by ASCA (top), Whipple (middle), and EGRET (bottom). Figure from Takahashi, Madejski, & Kubo (1999). |
Spurred by this result, another multiwavelength campaign was organized
in 1995 to better measure the multiwavelength properties of Mrk 421.
This campaign revealed, for the first time, correlations between
VHE
-rays and
X-rays
(Buckley et al. 1996).
Observations were conducted between April 20 and May 5 with the Whipple
Telescope, EGRET, ASCA, the Extreme Ultraviolet Explorer
(EUVE), an optical telescope, an optical polarimeter, and
UMRAO. Observations with EGRET did not result in a detection of
Mrk 421. The 2
flux upper limit for
E > 100 MeV is 1.2 × 10⁻⁷ cm-2
s-1, somewhat below the level detected in 1994. The light
curves for some of these observations are shown in
Figure 16. The optical data have the
contribution from the host galaxy of Mrk 421 subtracted off. As in the
1994 multiwavelength campaign, Mrk 421 underwent a large-amplitude flare
in VHE
-rays
during the observations. The flare is also clearly seen in the
ASCA and EUVE observations. There is some evidence for
correlated variability in the optical flux and polarization, but the
statistics are not good enough for such an association to be claimed
with confidence. The X-rays and VHE -rays appear to vary together, limited to the 1
day resolution of the VHE observations, and the amplitude of the flaring
is similar, ~ 400% difference between the peak flux and that at the end
of the observations. The EUVE and optical data (assuming it also is
correlated) are consistent with the flare being delayed by approximately
1 day relative to the X-rays and VHE
-rays. The
amplitude of the flare also decreases with decreasing energy. The XUV
flux varies by ~ 200% during the observations and the optical flux
varies by about 20%. The B-band percent polarization varies by
nearly a factor of 2 in the observations.
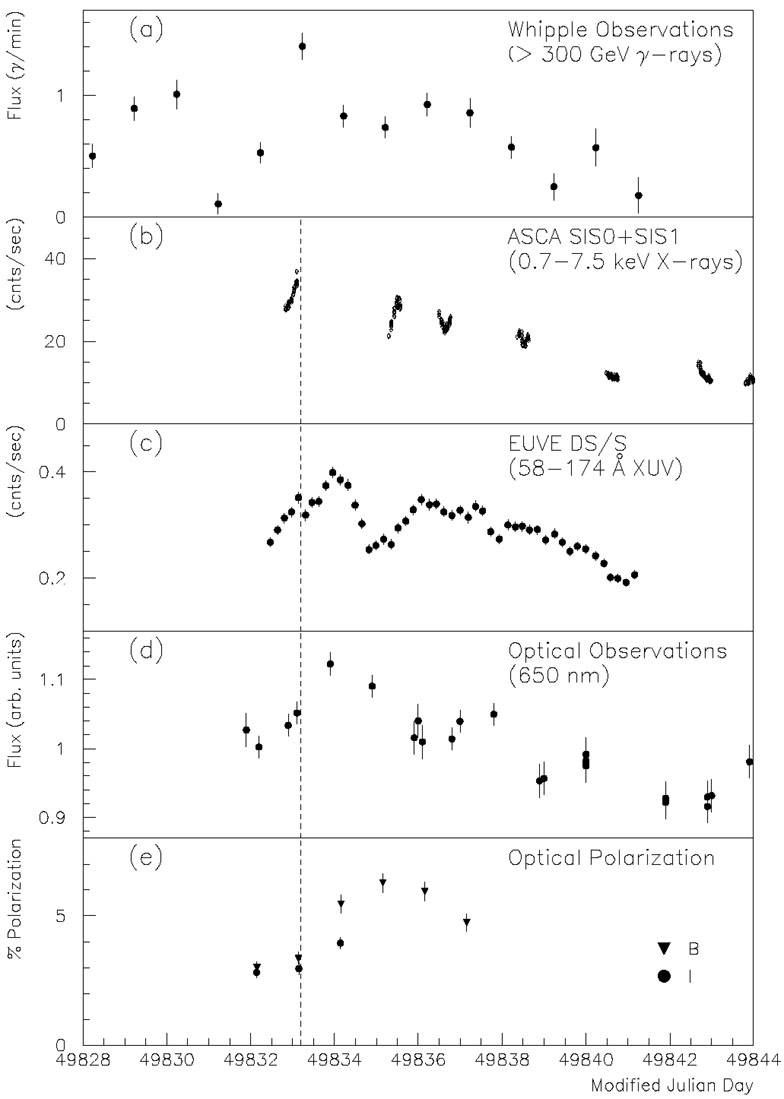 |
Figure 16. (a) Gamma-ray, (b) X-ray, (c) extreme-UV, (d) optical, and (e) optical polarization measurements of Mrk 421 taken 1995 April-May. April 26 corresponds to MJD 49,833. Figure from Buckley et al. (1996). |
The observations of Mrk 421 in 1994 and 1995 were clearly undersampled,
limiting the conclusions that could be drawn concerning correlations
between wavelengths and emission models. Two multiwavelength campaigns
organized in 1998 attempted to improve these measurements through more
dense observations in X-rays and VHE
-rays. Improvement in the VHE measurements came about
through longer VHE exposures with individual telescopes, to search for
hour-scale variations, and coordination of VHE observations between CAT,
HEGRA, and Whipple. Thus, light curves of 12-16 hours could in principle
be achieved, allowing much more detailed measurements of the VHE
emission. These observations yielded immediate improvements in the
measurements of flaring activity and correlations between VHE
-rays and
X-rays.
The first campaign, conducted in late 1998 April, was centered at X-ray
wavelengths on observations with the BeppoSAX satellite and
established the first hour-scale correlations between X-rays and -rays in a
blazar
(Maraschi et al. 1999).
The light curve for the observations by BeppoSAX in three X-ray
bands and Whipple above 2 TeV is shown in
Figure 17. The VHE threshold here is higher
than typical of Whipple data because observations were taken at a wide
range of elevations, causing the energy threshold and sensitivity to
vary with time. These effects were corrected in the light curve through
the use of simulations and analysis cuts to normalize the collection
area and energy threshold. Thus, the VHE light-curve rate variations are
intrinsic. As
Figure 17 shows, a flare is clearly detected in
X-rays and TeV
-rays on
the first day of observations. The peaks in the light curves occur at
the same time, within 1 hour, but the falloff in the X-ray flux is
considerably slower than the TeV
-rays.
Also, the TeV
-rays have
a larger variability amplitude (~
fourfold ratio between average and peak) than the X-rays (~ twofold
ratio). Both the faster VHE flux decrease and the larger amplitude
variability have not been seen previously in Mrk 421. These observations
provide the first clear indication that X-rays and VHE
-rays may
not be completely correlated on all timescales.
 |
Figure 17. Light curves for observations of Mrk 421 in 1998 April by Whipple and BeppoSAX. Whipple observations are for E > 2 TeV and are binned in 28 minute observing segments. All count rates are normalized to their respective averages (listed at the top of each panel) for the observations shown. Figure from Maraschi et al. (1999). |
The second multiwavelength campaign started in late 1998 April,
immediately after the observations discussed above, and was centered
around a 7 day continuous observation of Mrk 421 with ASCA
(Takahashi, Madejski,
& Kubo 1999).
The light curves for the X-ray observations and VHE observations by
Whipple, CAT, and HEGRA are shown in
Figure 18. Had these observations been
conducted as in 1994 and 1995, with short X-ray exposures and just
Whipple observations, the results would have shown nothing new: similar
variability scale between the X-rays and VHE
-rays and
some subday-scale X-ray variability with amplitude too low to be
resolved with the Whipple observations. Instead, the X-ray observations
reveal the complete cycle of about 10 flares, the first time this has
been done for Mrk 421. Also, these observations seem to confirm the
supposition of
Buckley et al. (1996)
that the VHE emission from Mrk 421 is primarily the result of flares,
with little steady emission evident. Finally, the combination of VHE
data from these telescopes confirms the subday-scale correlations seen
in the Whipple/BeppoSAX observations. Detailed comparisons of the
VHE
-ray and
X-ray data will require more sophisticated normalization of the VHE data
(e.g., to common threshold energies) and investigation of systematics in
the measures of variability, but the data hold the promise of
significantly advancing our study of VHE-emitting
-ray
blazars. They also clearly demonstrate the benefits of operating
multiple VHE
-ray
installations in understanding the nature of variable sources.
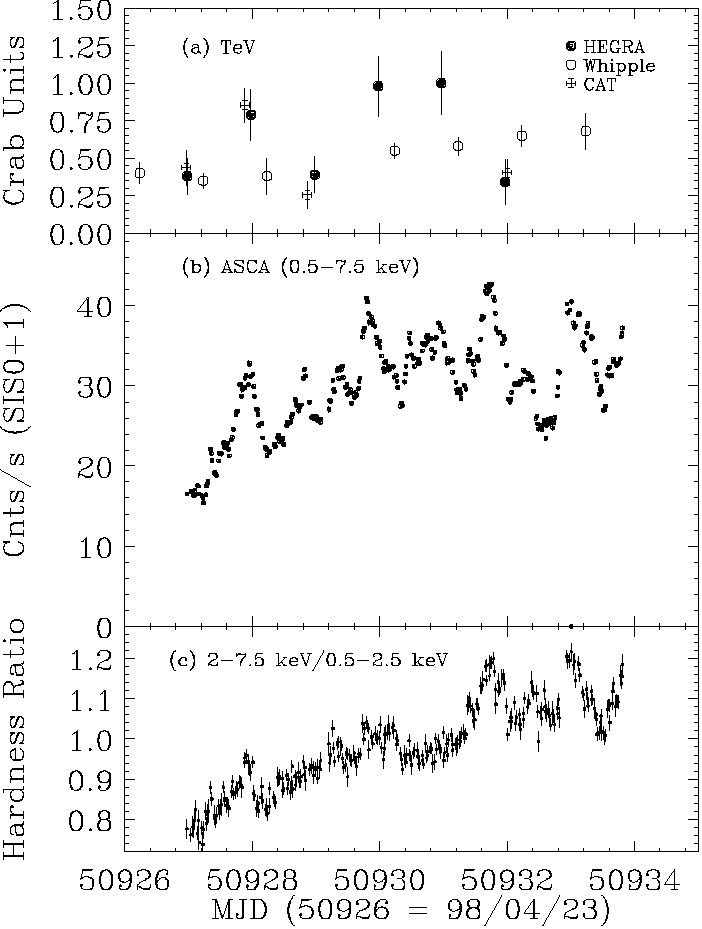 |
Figure 18. Light curves for observations of Mrk 421 in 1998 April-May. (a) VHE flux observed with HEGRA, Whipple, and CAT, (b) X-ray flux observed with ASCA, and (c) X-ray hardness ratios observed with ASCA are shown. Figure from Takahashi et al. (1999). |
The first multiwavelength observations of Mrk 501 which included VHE
observations were conducted in 1996
(Kataoka et al. 1999).
The observations were conducted with the Whipple Telescope, EGRET,
ASCA, and an optical telescope. The light curve for these
observations is shown in Figure 19. The
observations were too undersampled, or insensitive in the case of EGRET,
to clearly establish any correlations, but these observations have two
very important results. First, follow-up observations in 1996 May
established the first detection of Mrk 501 by EGRET, with a marginal
significance of 4.0
above 100 MeV but a
significance of 5.2
above 500 MeV,
indicating a hard photon spectrum
(Kataoka et al. 1999).
The claim of a 3.5
detection by EGRET during a small part of the multiwavelength campaign
(the region between the dashed lines in
Fig. 19) seems speculative, given the lack of
any increased activity in other wave bands during that period. Second,
the observations established a baseline spectral energy distribution for
Mrk 501 during a relatively low emission state which
could be compared
to observations of the high-state emission in 1997 (see below for
discussion of spectral energy distributions).
 |
Figure 19. Light curve for observations of
Mrk 501 in 1996 March. Observations in (a)
0.7-10 keV X-rays (ASCA), (b) 100 MeV-10 GeV
|
Multiwavelength observations of Mrk 501 during its high emission state
in 1997 revealed, for the first time, clear correlations between its VHE
-ray and
X-ray emission
(Catanese et al. 1997).
Observations were conducted with Whipple (nightly, April 7-19), EGRET
and the Oriented Scintillation Spectrometer Experiment (OSSE) on
CGRO (April 9-15), BeppoSAX (April 7, 11, 16), RXTE
(twice nightly, April 3-16), and the Whipple Observatory 1.2 m optical
telescope (nightly, April 7-15). The optical and X-ray observations were
serendipitously scheduled at this time, and the CGRO observations
were a public target of opportunity observation initiated in response to
the high VHE emission state.
Figure 20 shows daily flux levels for the
contemporaneous observations of Mrk 501. The average flux level in the
U band in March is also included in the figure
(Fig. 20e, dashed line) to
indicate the significant
( 10%) increase in
flux between March and April. An 11 day rise and fall in flux is evident
in the VHE and X-ray wave bands, with peaks on April 13 and 16. The
50-150 keV flux detected by OSSE also increases between April 9 and 15,
with a peak on April 13. The optical data may show a correlated rise,
but the variation is small (at most 6%). Subtraction of the galaxy light
contribution will increase the amplitude of this variation, but it
should still remain lower than in X-rays, given that the R-band
contribution of the galaxy light is ~ 75%
(Wurtz, Stocke, &
Yee 1996)
and the U-band contribution should be much less. EGRET
observations indicated an excess of 1.5
, not a significant
detection. The ratio of the fluxes between April 13 and April 9 are 4.2,
2.6, 2.3, and 2.1 for the VHE
-ray, OSSE,
RXTE, 15-25 keV, and RXTE 2-10 keV emission, respectively.
10%) increase in
flux between March and April. An 11 day rise and fall in flux is evident
in the VHE and X-ray wave bands, with peaks on April 13 and 16. The
50-150 keV flux detected by OSSE also increases between April 9 and 15,
with a peak on April 13. The optical data may show a correlated rise,
but the variation is small (at most 6%). Subtraction of the galaxy light
contribution will increase the amplitude of this variation, but it
should still remain lower than in X-rays, given that the R-band
contribution of the galaxy light is ~ 75%
(Wurtz, Stocke, &
Yee 1996)
and the U-band contribution should be much less. EGRET
observations indicated an excess of 1.5
, not a significant
detection. The ratio of the fluxes between April 13 and April 9 are 4.2,
2.6, 2.3, and 2.1 for the VHE
-ray, OSSE,
RXTE, 15-25 keV, and RXTE 2-10 keV emission, respectively.
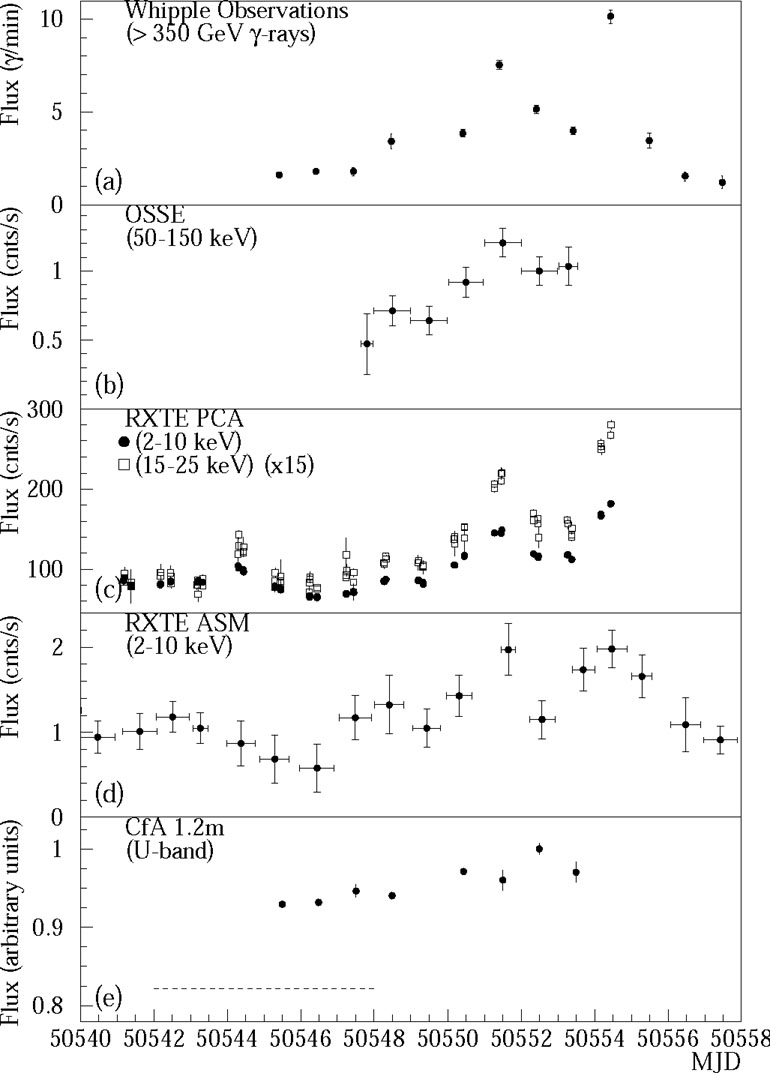 |
Figure 20. (a) VHE
|
The results of this campaign show that for Mrk 501, like Mrk 421, the
VHE -rays
and the soft X-rays vary together and the variability in the synchrotron
emission increases with increasing energy. However, OSSE has never
detected Mrk 421 despite several observations
(McNaron-Brown et
al. 1995),
while the Mrk 501 detection had the highest 50-150 keV flux ever
detected by OSSE from a blazar. A likely explanation of the OSSE
detection is that the synchrotron emission in Mrk 501 extends to 100
keV, compared with the ~ 1 keV cutoff seen in Mrk 421. This explanation
was first confirmed by the observations with BeppoSAX
(Pian et al. 1998).
In addition, the day-scale variations for Mrk 501 are larger in
-rays than
in X-rays, unlike Mrk 421. So, despite the similarity of Mrk 421 and Mrk 501 in some respects, these multiwavelength
campaigns are beginning to reveal differences in the two objects.
In these short multiwavelength campaigns, there appears to be a
correlation between the X-rays and VHE
-rays. A
natural question to ask is whether this is always true or only during
certain situations. An attempt to answer this question has been made by
the HEGRA collaboration by comparing their observations of Mrk 501 above
500 GeV to those by the RXTE All-Sky Monitor (ASM), measuring
2-12 keV photons
(Aharonian et al. 1999a).
A cross-correlation analysis of the daily average flux measured by the
ASM with the daily average flux measured by HEGRA reveals a peak in the
correlation function at
 t = 0 ±
1 day. However, the peak in the cross-correlation function is only ~
0.4, and the significance of the peak is only
2-3 . Whether this
indicates that the X-ray/TeV correlation is not present is
unclear because the ASM data have large statistical and significant
systematic uncertainties for day-scale measurements of this relatively
dim X-ray source (i.e., compared with the X-ray binaries the ASM was
designed to monitor). Also, because HEGRA sits on the falling edge of
the high-energy spectrum and the ASM sits (for Mrk 501 in 1997) on the
rising edge of the synchrotron spectrum, it is possible that the
emission detected by these two instruments will not be completely
correlated, particularly for day-scale variations. Comparison of longer
term variability between the measurements might help resolve such issues.
t = 0 ±
1 day. However, the peak in the cross-correlation function is only ~
0.4, and the significance of the peak is only
2-3 . Whether this
indicates that the X-ray/TeV correlation is not present is
unclear because the ASM data have large statistical and significant
systematic uncertainties for day-scale measurements of this relatively
dim X-ray source (i.e., compared with the X-ray binaries the ASM was
designed to monitor). Also, because HEGRA sits on the falling edge of
the high-energy spectrum and the ASM sits (for Mrk 501 in 1997) on the
rising edge of the synchrotron spectrum, it is possible that the
emission detected by these two instruments will not be completely
correlated, particularly for day-scale variations. Comparison of longer
term variability between the measurements might help resolve such issues.
Figure 21 shows the spectral energy distributions (SEDs), expressed as power per logarithmic bandwidth, for Mrk 421 and Mrk 501 derived from contemporaneous multiwavelength observations and an average of noncontemporaneous archival measurements. Both have a peak in the synchrotron emission at X-ray frequencies, as is typical of X-ray-selected BL Lac objects, and a high-energy peak whose exact location is unknown but must lie in the 10-250 GeV range. Both the synchrotron and high-energy peak are similar in power output, unlike the EGRET-detected flat-spectrum radio quasars, which can have high-energy peaks well above the synchrotron peaks (e.g., von Montigny et al. 1995). Also, during flaring episodes, the X-ray spectrum in both objects tends to harden significantly (Takahashi et al. 1996, 1999; Pian et al. 1998) while the VHE spectrum is not observed to change.
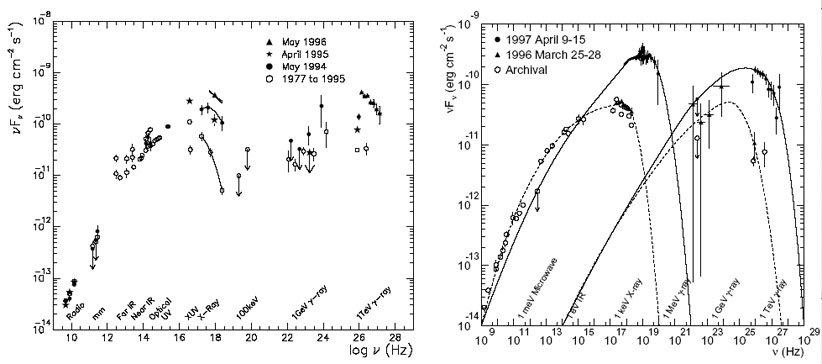 |
Figure 21. Left: The spectral energy distribution of Mrk 421 from contemporaneous and archival observations. Dates of the observations are indicated in the figure. Figure from Buckley et al. (1997). Right: The spectral energy distribution of Mrk 501 from contemporaneous and archival observations. Dates of the observations are indicated in the figure. Data in the figure come from Kataoka et al. (1999), Catanese et al. (1997), and Catanese (1999) and references therein. The curves in the figure are meant to guide the eye to the contemporaneously measured points and do not indicate model fits to the data, nor are they an attempt to elucidate the spectral energy distribution of Mrk 501 during these observations. In both figures, the archival measurements are approximate averages of the data in the literature. |
The SEDs of the two sources do, however, exhibit important differences. Most prominent among these is that the combination of contemporaneous RXTE and OSSE observations of Mrk 501 in 1997 clearly confirm the initial measurements of Pian et al. (1998) that the synchrotron spectrum extended well beyond the ~ 1 keV typical of X-ray-selected BL Lac objects. They also establish that the peak power output of the synchrotron emission occurs at ~ 100 keV. This is in contrast to the 1996 observations of Mrk 501 reported by Kataoka et al. (1999), where the synchrotron power peak is at ~ 2 keV. For Mrk 421, the X-ray spectral peak does shift to higher energies during flaring activity, but the changes are much smaller than in Mrk 501, and the peak was never observed to extend beyond ~ 1 keV. This peak is followed by a sharp cutoff which produces a deficit in the OSSE range, preventing the detection of Mrk 421 by this instrument.
Whether the shift in the location of the synchrotron peak for Mrk 501 is
also accompanied by a shift in the onset of the
-ray
emission to higher energies is not clear. Any increase in the MeV-eV
flux in 1997 was not as great as at TeV energies, or EGRET would have
easily detected Mrk 501. But, because the sensitivity of EGRET in 1997
was substantially poorer than in 1996, a shift in the onset of the
spectrum or a flux variation that increases with increasing energy could
explain the nondetection by EGRET. The fact that the VHE spectrum of
Mrk 501 is harder than that of Mrk 421 below ~ 1 TeV (see
Fig. 13) may also indicate that the high-energy
peak of Mrk 501 is shifted to slightly higher
energies. However, it could
also simply indicate a slower falloff in the progenitor particle
spectrum above the peak power output.
A second difference in the spectral energy distributions for these two
objects is that the power output for Mrk 501 in the VHE range can be
considerably less than in X-rays when it is in a low emission state. In
contrast, Mrk 421 seems to maintain a similar output at X-ray and
-ray
energies. These differences are illustrated in
Table 5, which gives the ratio of
contemporaneously measured fluxes for X-rays and
-rays for
these two objects. Whether the difference in power output for Mrk 501
reflects a change of the energy at which the peak in the high-energy
spectrum occurs or something related to the flaring process is not
clear, because of the poor spectral measurements in the low emission
states and the lack of coverage of the peak region of the
spectrum. However, the lack of spectral variability in
-rays argues
against a significant short-term shift of the
-ray
spectral peak.
| Source | Date | R2 keV a | R100 keV b | R100 MeV c | Reference |
| Mrk 421... | 1995 | 2.2 ± 0.5 | ... | <0.38 | 1 |
| 1996 | 0.81 ± 0.06 | ... | ... | 2 | |
| Mrk 501... | 1996 | 4.4 ± 2.1 | ... | 3.1 ± 3.4 | 3 |
| 1997 | 1.2 ± 0.3 | 1.9 ± 0.5 | <0.36 | 4 | |
| a
F (2 keV) /
F (350 GeV).
b
F (100 keV) /
F (350 GeV).
c
F (100 MeV) /
F (350
GeV). |
|||||
| References. (1) Buckley et al. 1996; (2) Buckley et al. 1997; (3) Kataoka et al. 1999; (4) Catanese et al. 1997; Catanese 1999. | |||||
4.1.3. Implications of the VHE Observations
The general properties of the detected extragalactic sources of VHE
-rays are
listed in Table 6. The three objects detected by the
Whipple Collaboration exhibit some interesting commonalities. They are
the three closest known BL Lac objects with declination below 0°,
so their
-ray fluxes
are the least attenuated from interaction with background IR
radiation. The above 100 MeV fluxes are near (Mrk 421, Mrk 501) or below
(1ES 2344+514) the EGRET sensitivity limit, meaning
that the
-ray power
output does not peak in that energy range as it does for many of the
EGRET-detected AGNs
(von Montigny et
al. 1995).
Thus, VHE observations already augment the catalog of
-ray
sources compiled by space-borne telescopes. Finally, all three of the
Whipple-detected BL Lac objects are X-ray-selected BL Lac objects
(XBLs). The extension of the synchrotron spectra to X-ray energies in
XBLs implies that they produce high-energy electrons, making them good
candidates for VHE emission if the VHE
-rays are
produced via inverse Compton (IC) scattering of these same
electrons. EGRET's tendency to detect more radio-selected BL Lac objects
(RBLs) than XBLs
(Lin et al. 1997)
also supports this tenet because RBLs would be expected to have spectra
which peak in the MeV-GeV range
(Sikora et al. 1994;
Marscher & Travis
1996).
BL Lac objects in general have been suggested as better candidates for
VHE emission than other blazars because the absence of optical emission
lines in BL Lac objects may indicate less VHE-absorbing radiation near
the emission region
(Dermer &
Schlickeiser 1994).
| Object | z | EGRET Flux a (E > 100 MeV) (10-7 cm-2 s-1) |
Average Flux (E > 300 GeV) (10-12 cm-2 s-1) |
Mv a |  X a X a(2 keV) (µJy) |
R a (5 GHz) (mJy) |
| Mrk 421... | 0.031 | 1.4 ± 0.2 | 40 | 14.4 | 3.9 | 720 |
| Mrk 501... | 0.034 | 3.2 ± 1.3 |  8.1 8.1 |
14.4 | 3.7 | 1370 |
| 1ES 2344+514 c... | 0.044 | < 0.7 |  8.2 8.2 |
15.5 | 1.1 | 220 |
| PKS 2155-304 c... | 0.116 | 3.2 ± 0.8 | 42 | 13.5 | 5.7 | 310 |
| 3C 66A c... | 0.444 | 2.0 ± 0.3 | 30 b | 15.5 | 0.6 | 806 |
a Radio, optical, and
X-ray data from
Perlman et al. 1996.
EGRET data from D. J. Thompson 1996, private communication,
Mukherjee et al. 1997,
and Kataoka et
al. 1999.
|
||||||
The other two objects detected at VHE energies, PKS 2155-304 and 3C 66A,
are similar in some respects to the Whipple sources. PKS 2155-304 is an
XBL, so it fits the IC paradigm for VHE sources. However, 3C 66A is
classified as an RBL, suggesting that protons produce the
-rays
because in IC models, RBLs would not have high enough energy electrons
to produce TeV emission. In addition, both PKS 2155-304 and 3C 66A are
at much higher redshifts than the Whipple sources, implying quite low IR
backgrounds. Thus, confirmation of these detections, just as for
1ES 2344+514, is essential.
VHE observations have already significantly affected our understanding
of BL Lac objects. For example, the rapid variability either indicates
very low accretion rates and photon densities near the nucleus
(Celotti, Fabian, &
Rees 1998)
or, conversely, requires the
-ray
emission region to be located relatively far from the nucleus to escape
the photon fields
(Protheroe &
Biermann 1997).
Also, the observations have helped resolve the nature of the differences
between RBLs and XBLs. Based on their smaller numbers and higher
luminosities,
Maraschi et al. (1986)
proposed that RBLs were the same as XBLs but with jets aligned more
closely with our line of sight. However, the rapid variability and TeV
extent of the XBL emission point to the differences between the two
subclasses being more fundamental, as originally proposed by
Padovani & Giommi
(1994):
the XBLs have higher maximum electron energies and lower intrinsic
luminosities.
Simultaneous measurements of the synchrotron and VHE
-ray
spectra also constrain the magnetic field strength (B) and
Doppler factor
( ) of the jet. If the
correlation between the VHE
-rays and
optical/UV photons observed in 1995 from Mrk 421 indicates both sets of
photons are produced in the same region of the jet,
5 is required for
the VHE photons to escape significant pair-production losses
(Buckley et al. 1996).
If the SSC mechanism produces the VHE
-rays,
= 15-40 and B =
0.03-0.9 G for Mrk 421
(Buckley et al. 1997;
Tavecchio, Maraschi,
& Ghisellini 1998;
Catanese 1999) and
1.5-20 and B
= 0.08-0.2 G for Mrk 501
(Samuelson et al. 1998;
Tavecchio et al. 1998;
Hillas 1999).
To match the variability timescales of the correlated emission, proton
models which utilize synchrotron cooling as the primary means for proton
energy losses require magnetic fields of B = 30-90 G for
10
(Mannheim 1993,
1998;
Buckley 1998).
The Mrk 421 values of
and B are extreme for blazars, but they are still within
allowable ranges and are consistent with the extreme variability of Mrk 421.
) of the jet. If the
correlation between the VHE
-rays and
optical/UV photons observed in 1995 from Mrk 421 indicates both sets of
photons are produced in the same region of the jet,
5 is required for
the VHE photons to escape significant pair-production losses
(Buckley et al. 1996).
If the SSC mechanism produces the VHE
-rays,
= 15-40 and B =
0.03-0.9 G for Mrk 421
(Buckley et al. 1997;
Tavecchio, Maraschi,
& Ghisellini 1998;
Catanese 1999) and
1.5-20 and B
= 0.08-0.2 G for Mrk 501
(Samuelson et al. 1998;
Tavecchio et al. 1998;
Hillas 1999).
To match the variability timescales of the correlated emission, proton
models which utilize synchrotron cooling as the primary means for proton
energy losses require magnetic fields of B = 30-90 G for
10
(Mannheim 1993,
1998;
Buckley 1998).
The Mrk 421 values of
and B are extreme for blazars, but they are still within
allowable ranges and are consistent with the extreme variability of Mrk 421.
In addition, the VHE observations have constrained the types of models
that are likely to produce the
-ray
emission. For instance, the correlation of the X-ray and the VHE flares
is consistent with IC models where the same population of electrons
radiate the X-rays and
-rays. The
absence of flaring at EGRET energies may also follow in this context
(Macomb et al. 1995)
because the lower energy electrons which produce the
-rays in
the EGRET range radiate away their energy more slowly than the higher
energy electrons which produce the VHE emission. The MeV-GeV emission
could then be the superposition of many flare events and would therefore
show little or no short-term variation.
In the mechanism of
Sikora et al. (1994),
which produces
-rays
through the Comptonization of external photons, the external photons
must have energies lower than 0.1 eV (in the IR band) to avoid
significant attenuation of the VHE
-rays by
pair production.
Sikora et al. (1994)
point out that there is little direct observational evidence of such an
IR component in BL Lac objects, but the existence of such a field has
been predicted as a product of accretion in AGNs
(Rees et al. 1982).
Models which produce the
-ray
emission from proton progenitors through
e+e- cascades originating close to
the base of the AGN jet have great difficulty explaining the TeV
emission observed in Mrk 421 because the high densities of unbeamed
photons near the nucleus, such as the accretion disk or the broad-line
region, required to initiate the cascades cause high pair opacities to
TeV
-rays
(Coppi, Kartje, &
Königl 1993).
Such models also predict that the radius at which the optical depth for
- pair production
drops below unity increases with increasing
-ray energy
(Blandford &
Levinson 1995),
and therefore the VHE
-rays
should vary either later or more slowly than the MeV-GeV
-rays. This
is in contradiction to the observations of Mrk 421 in both 1994
(Macomb et al. 1995)
and 1995
(Buckley et al. 1996).