


4.2. Extragalactic Background Light
In traversing intergalactic distances,
 -rays may
be absorbed by photon-photon pair production
( +
-rays may
be absorbed by photon-photon pair production
( +
 e+
+ e-) on background photon fields if the center of
mass energy of the photon-photon system exceeds twice the rest energy of
the electron
(Gould &
Schréder 1967).
The cross section for this process peaks when
e+
+ e-) on background photon fields if the center of
mass energy of the photon-photon system exceeds twice the rest energy of
the electron
(Gould &
Schréder 1967).
The cross section for this process peaks when
 |
(1) |
where E is the energy of the
-ray,
 is the energy of
the low-energy photon,
is the energy of
the low-energy photon,  is the collision angle between the two photons,
me is the mass of the electron, and c is
the speed of light in vacuum. Thus, for photons of energy near 1 TeV,
head-on collisions with photons of ~ 0.5 eV have the highest cross
section, although a broad range of optical-IR wavelengths can be
important absorbers because the cross section for pair production is
rather broad in energy and spectral features in the extragalactic
background density can make certain wave bands more important than the
cross section alone would indicate.
is the collision angle between the two photons,
me is the mass of the electron, and c is
the speed of light in vacuum. Thus, for photons of energy near 1 TeV,
head-on collisions with photons of ~ 0.5 eV have the highest cross
section, although a broad range of optical-IR wavelengths can be
important absorbers because the cross section for pair production is
rather broad in energy and spectral features in the extragalactic
background density can make certain wave bands more important than the
cross section alone would indicate.
The presence of extragalactic background light (EBL) limits the distance
to which VHE
-ray
telescopes can detect sources. This has been put forth as an explanation
of the lack of detection of many of the EGRET-detected AGNs (e.g.,
Stecker, de Jager,
& Salamon 1992),
as discussed above. The difficulty in understanding the effect of the
EBL on the opacity of the universe to VHE
-rays is
that not much is known about the spectrum of the EBL at present or how
it developed over time. Star formation is expected to be a major
contributor to the EBL (e.g.,
Madau et al. 1996;
Primack et al. 1999),
with star formation contributing mainly at short wavelengths (1-15
µm) and dust absorption and re-emission contributing at
longer wavelengths (15-50 µm). So, measurements of the EBL
spectrum can serve as important tracers of the history of the formation
of stars and galaxies
(Dwek et al. 1998).
Other, more exotic processes, such as pregalactic star
formation and some dark matter candidates, might also contribute
distinctive features to the EBL (e.g.,
Bond, Carr, & Hogan
1986,
1991).
Thus, measurements of the EBL
have the potential to provide a wealth of information about several
important topics in astrophysics.
Experiments that attempt to measure the EBL by directly detecting optical-IR photons, such as the Diffuse Infrared Background Experiment (DIRBE) on the Cosmic Background Explorer (COBE), are plagued by foreground sources of IR radiation. Emitted and scattered light from interplanetary dust, emission from unresolved stellar components in the Galaxy, and dust emission from the interstellar medium are all significantly more intense than the EBL and must be carefully modeled and subtracted to derive estimates of the EBL. Currently, EBL detections are available only at 140 and 240 µm (Hauser et al. 1998). Tentative detections at 3.5 µm (Dwek & Arendt 1998) and 400-1000 µm (Puget et al. 1996) have also been reported.
Because VHE
-rays are
attenuated most by optical-IR photons, measurements of the spectra of
AGNs provide an indirect means of investigating the EBL that is not
affected by local sources of IR radiation
(Gould &
Schréder 1967;
Stecker et al. 1992).
The signs of EBL absorption can be cutoffs, but also simple alterations
of the spectral index (e.g.,
Stecker 1999),
depending on the spectral shape of the EBL and the distance to the
source. Like direct measurements of the EBL, this technique has
difficulties to overcome. For instance, it requires some knowledge of or
assumptions about the intrinsic spectrum and flux normalization of the
AGNs or the EBL. Also, the AGNs themselves produce dense radiation
fields which can absorb VHE
-rays at
the source and thereby mimic the effects of the intergalactic EBL
attenuation.
Despite these difficulties, the accurate measurement of VHE spectra with no obvious spectral cutoffs from just the two confirmed VHE-emitting AGNs, Mrk 421 and Mrk 501 (see Section 4.1.1), has permitted stringent limits to be set on the density of the EBL over a wide range of wavelengths. These limits have been derived from two approaches: (1) assuming a limit to the hardness of the intrinsic spectrum of the AGNs and deriving limits which assume very little about the EBL spectrum (e.g., Biller et al. 1998; Stanev & Franceschini 1998), and (2) assuming some shape for the EBL spectrum, based on theoretical or phenomenological modeling of the EBL, and adjusting the normalization of the EBL density to match the measured VHE spectra (e.g., de Jager, Stecker, & Salamon 1994; Stanev & Franceschini 1998). The latter can be more stringent but are necessarily more model dependent. The limits from these indirect methods and from the direct measurements of EBL photons are summarized in Figure 22. At some wavelengths, the TeV limits represent a 50-fold improvement over the limits from DIRBE. These limits are currently well above the predicted density for the EBL from normal galaxy formation (Madau et al. 1996; Primack et al. 1999), but they have provided constraints on a variety of more exotic mechanisms for sources of the EBL (e.g., Biller et al. 1998). They also show that EBL attenuation alone cannot explain the lack of detection of EGRET sources with nearby redshifts at VHE energies, as the optical depth for pair production does not reach 1 for the stringent limits of Biller et al. (1998) until beyond a redshift of z = 0.1 (see Fig. 23). With the detection or more AGNs, particularly at higher redshift, and improvements in our understanding of the emission and absorption processes in AGNs, VHE measurements have the potential to set very restrictive limits on the EBL density, and perhaps eventually detect it.
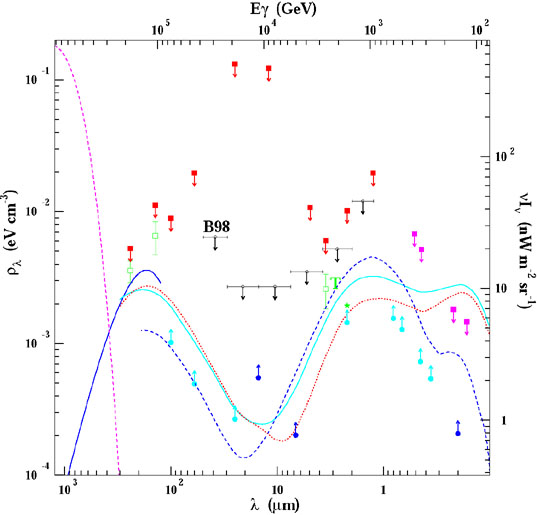 |
Figure 22. The diffuse intergalactic
infrared background.
E |
 |
Figure 23. Lower limit of the redshift at which photons of the energies shown face an optical depth of 1 due to pair production with EBL. Limits are derived from the upper limits on the density of the EBL of Biller et al. (1998). Figure from Biller et al. (1998). |
 . Upper limits
derived from VHE
. Upper limits
derived from VHE