


15.5.2. Evolutionary Models of Radio Luminosity Functions
Ryle and Clarke (1961)
showed that their 178-MHz source count above S = 0.25
Jy is incompatible with nonevolving Einstein-de Sitter and steady-state
models. They also recognized that "the introduction of evolutionary
effects which appear to be necessary will make the selection of a unique
[world] model difficult." In a paper introducing many of the features
found in subsequent model calculations,
Longair (1966)
modeled the 178-MHz source count, strong-source luminosity
distribution, and integrated emission from discrete sources in an
evolving Einstein-de Sitter universe. "Power-law" evolution proportional
to (1 + z)n yielded satisfactory fits only if restricted
to the most luminous sources and truncated at high
redshifts. "Exponential" evolution proportional to
e-t/ , where
t is the cosmic time and
the evolutionary time
scale, was proposed by
Rowan-Robinson (1970)
because it does not diverge at high redshifts. Although this parametric
form shows that the data do not require a real truncation of evolution
at large z, Rowan-Robinson also
considered physical factors that must ultimately truncate
evolution, such as the time needed to form the parent galaxies of radio
sources and electron energy losses by
inverse Compton scattering off the microwave background radiation. A
parametric model explicitly constrained by astrophysical assumptions was
tried by
Grueff and Vigotti (1977)
to explain the 408-MHz source count and the luminosity distributions of
sources stronger than S = 10 Jy and S = 0.9 Jy. They
assumed that quasars form at z = 2.5 and evolve into galaxies
whose radio-emitting lifetimes are inversely
proportional to their radio luminosities. One difficulty with this model
is that the evolution of low-luminosity radio sources can be minimized
only if their radio emitting lifetimes are comparable with the Hubble time.
, where
t is the cosmic time and
the evolutionary time
scale, was proposed by
Rowan-Robinson (1970)
because it does not diverge at high redshifts. Although this parametric
form shows that the data do not require a real truncation of evolution
at large z, Rowan-Robinson also
considered physical factors that must ultimately truncate
evolution, such as the time needed to form the parent galaxies of radio
sources and electron energy losses by
inverse Compton scattering off the microwave background radiation. A
parametric model explicitly constrained by astrophysical assumptions was
tried by
Grueff and Vigotti (1977)
to explain the 408-MHz source count and the luminosity distributions of
sources stronger than S = 10 Jy and S = 0.9 Jy. They
assumed that quasars form at z = 2.5 and evolve into galaxies
whose radio-emitting lifetimes are inversely
proportional to their radio luminosities. One difficulty with this model
is that the evolution of low-luminosity radio sources can be minimized
only if their radio emitting lifetimes are comparable with the Hubble time.
Extensions of the source counts to lower flux densities and the availability of more complete redshift data for strong sources eventually justified reexamination of the first parametric models. Wall et al. (1980) found that the 408-MHz source count extending to S = 0.01 Jy and the "all-sky" luminosity distribution of sources stronger than S = 10 Jy were sufficient to show that "power law" models are a poor representation of the cosmological evolution of powerful radio sources. They also investigated "exponential" evolution of the form exp[M(1 - t / t0)], where M specifies the strength of the evolution and t0 is the present age of the universe. Successful models were constructed in which M depends on luminosity [e.g., M = 0 for L < L1, M = Mmax for L > L2, and M = Mmax(log L - log L1) / (log L2 - log L1) for L1 < L < L2] or redshift. Robertson's (1978, 1980) "free-form" analysis of essentially the same data did not assume a functional form for the redshift dependence of evolution, but used the data to solve for it. However, these data cannot fully determine both the redshift and luminosity dependence of the evolution, so Robertson did assume a parametric form for the luminosity dependence that is similar to the one specified above. An artifact of the rather sharp changes of evolution with luminosity implied by this parametric form is a markedly bimodal redshift distribution at low flux densities (cf. Figure 10 of Wall et al. 1980).
The preceding models approximate the spectral-index distributions of all
sources by a single
 -function centered on

 0.8, and they
work well for data selected at any one low
(
0.8, and they
work well for data selected at any one low
( < 1 GHz)
frequency. Extensive sky surveys made at 2.7 and 5 GHz
in the late 1960s revealed significant populations of sources with
0 and led to
models accounting for both the steep- and flat-spectrum sources
simultaneously
(Schmidt 1972,
Fanaroff and Longair 1973,
Petrosian and Dickey
1973).
The decline
in the fraction of flat-spectrum sources as the 5-GHz sample
flux-density limit is decreased below
S 1 Jy
(Figure 15.6)
can be reproduced if (1) the local spectral
luminosity function is separated or "factorized" into independent
spectral-index and luminosity functions at some frequency of lower than
5 GHz and (2) the rate of
evolution is the same for both steep- and flat-spectrum sources. Then
there is an inverse correlation induced between a and L at higher
frequencies, and the weighted
5-GHz count of flat-spectrum sources peaks at a higher flux density than
the weighted count of steep-spectrum sources.
< 1 GHz)
frequency. Extensive sky surveys made at 2.7 and 5 GHz
in the late 1960s revealed significant populations of sources with
0 and led to
models accounting for both the steep- and flat-spectrum sources
simultaneously
(Schmidt 1972,
Fanaroff and Longair 1973,
Petrosian and Dickey
1973).
The decline
in the fraction of flat-spectrum sources as the 5-GHz sample
flux-density limit is decreased below
S 1 Jy
(Figure 15.6)
can be reproduced if (1) the local spectral
luminosity function is separated or "factorized" into independent
spectral-index and luminosity functions at some frequency of lower than
5 GHz and (2) the rate of
evolution is the same for both steep- and flat-spectrum sources. Then
there is an inverse correlation induced between a and L at higher
frequencies, and the weighted
5-GHz count of flat-spectrum sources peaks at a higher flux density than
the weighted count of steep-spectrum sources.
There have been some indications that flat-spectrum quasars may evolve
less than steep-spectrum or optically selected quasars. The weighted
count of flat-spectrum sources (mostly quasars) peaks near
S 1 Jy
(Figure 15.6), so the
average count slope is nearly Euclidean for the flat-spectrum
sources found in the first large-scale
5-GHz surveys that are complete down to
S 0.6
Jy. Because the source count slope and <V /
Vm> (< ahref="Condon4.html#4.1">Section 15.4.1)
are closely related
(Longair and Scheuer
1970),
quasar identifications of flat-spectrum sources from these surveys have
nearly static-Euclidean values <V / Vm>
0.5
(Schmidt 1976),
much lower than the <V / Vm>
0.7
of quasars identified with primarily steep-spectrum 3CR quasars stronger
than S = 9 Jy at = 178 MHz
(Schmidt 1968).
While high <V / Vm> values indicate
evolution, <V / Vm>
0.5 does not exclude
evolution because the distribution of
<V / Vm> may still be
nonuniform. Evolution increasing at low redshifts (z < 2, for
example) and decreasing at higher redshifts still in the sample volumes
Vm could yield a nonuniform
V / Vm distribution with
<V / Vm>
0.5. Just this
situation is probably occurring. The 3CR quasars can be seen only out
to limiting redshifts
zm
2, and their large <V / Vm> value
reflects monotonically increasing evolution up to z
2;
flat-spectrum quasars stronger than S = 0.6 Jy can be seen at higher
redshifts (zm
3 or 4) where their evolution has started to decline.
Kulkarni (1978)
produced models that allow the steep- and flat-spectrum populations to
evolve independently,
approximate the spectral-index distributions of each population by
Gaussians, and include the correlation of
with L among
steep-spectrum sources. In both the
Kulkarni (1978) and
Machalski (1981)
models, the flat- and steep-spectrum sources
evolve differently, but later models by
Peacock and Gull (1981)
and Condon (1984b)
show that these two spectral classes may indeed evolve at the same rates
without violating the data constraints.
Condon (1984b)
searched for a single model to fit in detail a wide range of
available radio data (the local luminosity functions of spiral and
elliptical galaxies
at = 1.4 GHz; source counts at
= 0.408, 0.61, 1.4, 2.7, and
5 GHz; counts of steep- and flat-spectrum sources at
= 2.7 and 5 GHz;
spectral-index distributions of sources in a number of samples complete
to different flux-density limits at
= 1.4,
2.7, and 5 GHz; redshift/spectral-index diagrams and redshift
distributions of strong sources selected at 1.4, 2.7, and 5 GHz). The
local 1:4-GHz visibility functions of
spiral and elliptical galaxies were approximated by hyperbolas
[< ahref="Condon4.html#Figure 3">Figure 15.3(b)].
The spectral luminosity function was "factorized" at
vf = 1.4 GHz. The spectral-index function was
approximated by two Gaussians, and the median spectral index
of the steep-spectrum Gaussian varied with log(z). The evolution was
constrained by the assumption that the form of the
= 1.4 GHz luminosity
function be independent of redshift:
 |
(15.29) |
where f (z) and g(z) are "free-form"
functions that describe "luminosity evolution"
and "density evolution," respectively. This "translation evolution" [so
named because the evolution can be represented by translating the local
luminosity function in the (log L,
log m)-plane] could result from evolutionary mechanisms
that do not discriminate on the basis of source luminosity. A simple
model was found that fits the radio data (curves in
Figures 15.3,
15.5 -
15.9) as well as predicting
redshift distributions (Figure 15.10)
consistent with the magnitude
distributions of faint-source identifications. Large values of the
evolution function E(L, z)
(Figure 15.11) are restricted to high
luminosities, as they must be to avoid producing too
many faint sources. The luminosity range in which E(L,
z) is large is not a free
parameter in this model; it is determined by the location of the bend
near L
1025 W Hz-1 in the local luminosity function
[Figure 15.3(a)]. Since
this model assumes that all sources evolve equally, it demonstrates by
example that restricting large
E(L, z) values to high luminosities does not imply
that "only powerful
sources evolve." Such an overinterpretation of the evolution function
has led, for example,
to the incorrect belief that only the (relatively luminous) radio
quasars evolve, but that the (less luminous) radio galaxies do not.
m)-plane] could result from evolutionary mechanisms
that do not discriminate on the basis of source luminosity. A simple
model was found that fits the radio data (curves in
Figures 15.3,
15.5 -
15.9) as well as predicting
redshift distributions (Figure 15.10)
consistent with the magnitude
distributions of faint-source identifications. Large values of the
evolution function E(L, z)
(Figure 15.11) are restricted to high
luminosities, as they must be to avoid producing too
many faint sources. The luminosity range in which E(L,
z) is large is not a free
parameter in this model; it is determined by the location of the bend
near L
1025 W Hz-1 in the local luminosity function
[Figure 15.3(a)]. Since
this model assumes that all sources evolve equally, it demonstrates by
example that restricting large
E(L, z) values to high luminosities does not imply
that "only powerful
sources evolve." Such an overinterpretation of the evolution function
has led, for example,
to the incorrect belief that only the (relatively luminous) radio
quasars evolve, but that the (less luminous) radio galaxies do not.
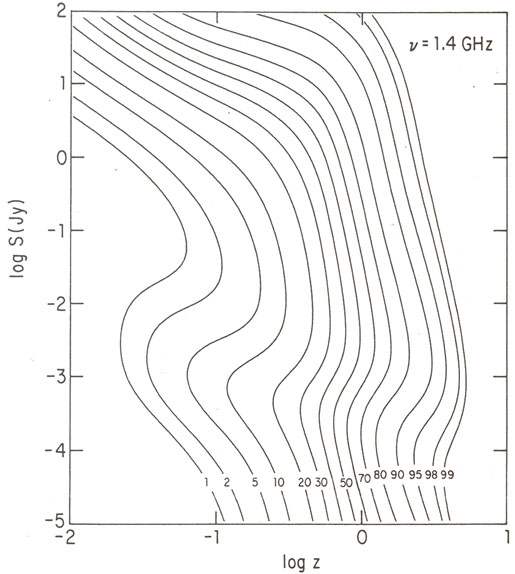 |
Figure 15.10. Model redshift distributions at
|
All of the models described above are based on strong assumptions about the
form of evolution in the (L, z)-plane. They show that
evolutionary forms consistent
with the data exist, but these solutions are certainly not unique. In
order to explore the range of luminosity functions consistent with
the source counts at = 0.408,
2.7, and 5 GHz, luminosity distributions, and optical identification data,
Peacock and Gull (1981)
generated a number of "free-form" models in which the evolution
is described by power series in log(L) and either log(1 +
z) or log(1 - t / t0) so that
it is "free-form" in both luminosity and time, at least to the extent
that evolution varies smoothly with these quantities. The
possibility of a sharp cutoff at high z
was also considered. Steep- and flat-spectrum sources were allowed to
evolve independently, and their spectral-index distributions were
approximated by -functions.
This approximation affects theaccuracy with which the model can
reproduce the radio data
(Condon 1984b)
but does not significantly increase the
uncertainty of the derived evolving luminosity functions
(Peacock 1985).
Their successful models indicate that flat- and steep-spectrum sources
evolve similarly,
with only the most luminous sources exhibiting large changes in their
comoving density with epoch. However, the density of sources in most
areas of the (L, z)-plane
is not well defined by the data. By locating the areas of greatest
uncertainty, Peacock and Gull could specify the most important data
still needed - source counts and
redshift distributions of faint flat-spectrum sources in particular. The
redshifts of forty-one flat-spectrum quasars with
S  0.5 Jy at
= 2.7 GHz were later added to the
Peacock and Gull (1981)
data base, and they allowed
Peacock (1985)
to suggest that the density of powerful flat-spectrum sources
declines between
z 2 and z 4
(unless the small number of quasars still lacking spectroscopic
redshifts all have z > 3).
0.5 Jy at
= 2.7 GHz were later added to the
Peacock and Gull (1981)
data base, and they allowed
Peacock (1985)
to suggest that the density of powerful flat-spectrum sources
declines between
z 2 and z 4
(unless the small number of quasars still lacking spectroscopic
redshifts all have z > 3).
 |
Figure 15.11. Contour plot of the
Condon (1984b)
model evolution function at |