


3.3. Physics of the LSP ?
The LSP may have the potential to connect key observables (luminosity
and size) to the fundamental underlying physical properties of bulge
and disk systems (mass and angular momentum). In various studies of
the formation of disk systems, (e.g.,
Fall & Efstathiou
1980,
Dalcanton et al. 1997,
Mo et al. 1998)
the dimensionless spin parameter
( = J
| E1/2| G-1
Mhalo-5/2,
Peebles 1969)
is directly related to the
scale-length of the disk. The spin parameter reflects how close the
halo is to a rotationally supported system and is a key parameter
monitored by the numerical simulations (see
Steinmetz &
Bartelmann 1995;
Cole & Lacey 1996;
Vitvitska et
al. 2002;
Maller, Dekel & Sommerville 2002
for example). The pivotal idea (here echoing the toy model of
de Jong & Lacey
2000)
starts with the premise that the baryons are coupled
to the dark matter halo, because of this the luminosity (generated by
the baryons in the form of stars) can be related to the systemic mass
and the rotation of the stars/gas can be related to the systemic
angular momentum. Given this premise, which is intimated by the
Tully-Fisher relation, one can analytically relate
to
luminosity and surface brightness (or size):
= J
| E1/2| G-1
Mhalo-5/2,
Peebles 1969)
is directly related to the
scale-length of the disk. The spin parameter reflects how close the
halo is to a rotationally supported system and is a key parameter
monitored by the numerical simulations (see
Steinmetz &
Bartelmann 1995;
Cole & Lacey 1996;
Vitvitska et
al. 2002;
Maller, Dekel & Sommerville 2002
for example). The pivotal idea (here echoing the toy model of
de Jong & Lacey
2000)
starts with the premise that the baryons are coupled
to the dark matter halo, because of this the luminosity (generated by
the baryons in the form of stars) can be related to the systemic mass
and the rotation of the stars/gas can be related to the systemic
angular momentum. Given this premise, which is intimated by the
Tully-Fisher relation, one can analytically relate
to
luminosity and surface brightness (or size):

 eff-1/2
L-
eff-1/2
L- /3 + 1/2 (from
de Jong & Lacey
2000),
where eff
is the effective surface
brightness, L is the intrinsic luminosity in some filter and
is the
dependence of luminosity on the mass-to-light ratio
(equal to 0.69 in B or 1.00 in H
Gavazzi, Pierrini
& Boselli 1996).
Numerical
simulations consistently find that the distribution of the spin
parameter is a log Normal distribution which is globally preserved
through hierarchical merging (see for example
Vitvitska et
al. 2002)
this yields:
eff =
LB0.54 or
µeff = 0.54 MB. Hence the
gradient of any luminosity-surface brightness
relation bears upon the relation between mass and light and the
dispersion upon the breadth of the spin distribution.
Fig. 7
shows the B-band LSP for a variety of samples as indicated (LG,
Mateo 1998; HDF,
Driver 1999;
MGC, Driver et
al. 2004;
MW GCs, Harris et al. (priv. comm); Local Sphere of Influence,
Jerjen, Binggeli &
Freeman 2000;
LSBGs, de Blok, van
der Hulst & Bothun 1995).
The solid lines show the
approximate expectation as argued above and show remarkable agreement
with the data - in detail the observed size distribution is marginally
narrower than simulations predict (see
Driver et al. 2004).
It is also worth noting that systems which form via merging (i.e.,
bulges) and via accretion (i.e., disks) are also predicted to show distinct
distributions (see
for example
Vitvitska et
al. 2002;
Maller et al. 2002).
At the moment far more data and detailed
simulations are required however this connection is clearly promising
and could ultimately result in a galaxy equivalent to the
Hertzsprung-Russell diagram, allowing a meeting ground between
numerical simulations and survey observations.
/3 + 1/2 (from
de Jong & Lacey
2000),
where eff
is the effective surface
brightness, L is the intrinsic luminosity in some filter and
is the
dependence of luminosity on the mass-to-light ratio
(equal to 0.69 in B or 1.00 in H
Gavazzi, Pierrini
& Boselli 1996).
Numerical
simulations consistently find that the distribution of the spin
parameter is a log Normal distribution which is globally preserved
through hierarchical merging (see for example
Vitvitska et
al. 2002)
this yields:
eff =
LB0.54 or
µeff = 0.54 MB. Hence the
gradient of any luminosity-surface brightness
relation bears upon the relation between mass and light and the
dispersion upon the breadth of the spin distribution.
Fig. 7
shows the B-band LSP for a variety of samples as indicated (LG,
Mateo 1998; HDF,
Driver 1999;
MGC, Driver et
al. 2004;
MW GCs, Harris et al. (priv. comm); Local Sphere of Influence,
Jerjen, Binggeli &
Freeman 2000;
LSBGs, de Blok, van
der Hulst & Bothun 1995).
The solid lines show the
approximate expectation as argued above and show remarkable agreement
with the data - in detail the observed size distribution is marginally
narrower than simulations predict (see
Driver et al. 2004).
It is also worth noting that systems which form via merging (i.e.,
bulges) and via accretion (i.e., disks) are also predicted to show distinct
distributions (see
for example
Vitvitska et
al. 2002;
Maller et al. 2002).
At the moment far more data and detailed
simulations are required however this connection is clearly promising
and could ultimately result in a galaxy equivalent to the
Hertzsprung-Russell diagram, allowing a meeting ground between
numerical simulations and survey observations.
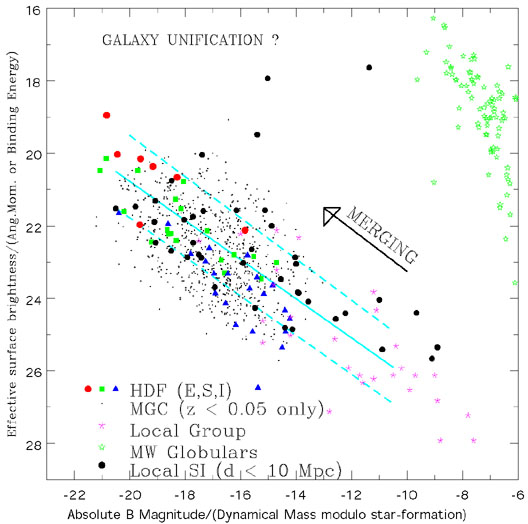 |
Figure 7. A summary of available LSP data drawn from a variety of sources. The red line marks the credibly mapped area and the cyan line shows the expectation from de Jong & Lacey (2000). This appears to follow the data remarkably well. |