


We now provide an overview of the abundance profile picture for spheroidal systems, especially elliptical galaxies. The principal techniques for measuring abundances in these systems involve the use of photometric indices of integrated starlight, since individual stars cannot be resolved. A brief description of these techniques is given in Appendix C. Elliptical galaxies look superficially like a fairly homogeneous class of galaxies, with muted star formation and no obvious cold gas and kinematically supported by almost randomly oriented orbits. Star formation can be seen in most ellipticals at some level, as can dust lanes and emission-line gas, but usually at a level below that of spirals. Ellipticals also exhibit regularity of colors and absorption feature strengths, with larger galaxies being redder and having stronger metallic absorption features than smaller ones. This has long been interpreted as a sign that the metallicity is higher in larger galaxies (see, e.g., Faber 1972).
To derive abundance profiles in stellar systems, colors and absorption
feature strengths as a function of galactocentric radius are interpreted
through population models. Some color gradient studies include
Kormendy & Djorgovski (1989),
Franx & Illingworth (1990), and
Peletier et al. (1990).
Most studies of optical absorption features have utilized one particular
system of feature indices developed at Lick Observatory (described in
Worthey et al. 1994
and references therein). The last few years have seen a rapid expansion
of galaxy data available in this system. To measure an absorption
feature in the Lick system, one creates a pseudocontinuum by bracketing
the spectral feature of interest with flanking passbands. Flux in the
flanking bands is measured and a straight line is drawn between the
midpoints of the flanking bands to represent the (pseudo)continuum. The
flux difference between the pseudocontinuum and the absorption feature
is integrated and the result is expressed in Å of equivalent width
(or magnitudes, depending on the specific index; see
Worthey et al. 1994
and Worthey & Ottaviani 1997
for the details). Figure 10 illustrates the
idea for a portion of the spectrum. There are 25 indices defined, five
definitions measuring Balmer lines and 20 measuring various metallic
absorption blends. The index system operates at a low resolution (~ 8
Å FWHM) necessitated by Doppler smearing from the substantial (up
to  = 350 km
s-1) velocity dispersions of large elliptical galaxies, and
most of the indices require corrections when velocity dispersions get
large.
= 350 km
s-1) velocity dispersions of large elliptical galaxies, and
most of the indices require corrections when velocity dispersions get
large.
 |
Figure 10. Mid-optical spectra of stars of differing spectral types are shown, with pseudocontinuum and central index passbands from the Lick index definitions shown. The hashed regions are the central passbands. Solid horizontal line segments mark the pseudocontinua on selected spectra. Dashed lines represent the "continuum" calculated by finding the average flux in the pseudocontinuum passbands and then drawing a straight line between pseudocontinuum midpoints. Indices are expressed either as equivalent widths, as in stellar spectroscopy, or as flux ratios in magnitudes, depending on the index. See Worthey et al. (1994) for the details. |
While most of these 25 indices follow the
 log(Age) /
log Z
log(Age) /
log Z
 - 3/2 constant-index
slope described in
Appendix C, a few (the Balmer indices) are
relatively age sensitive, with
log(Age) /
log Z
- 1/2 to -1, while
others, notably, a feature called Fe4668 whose main contributor is
really molecular carbon, are relatively metal sensitive, with
log(Age) /
log Z
-5
(Worthey 1994).
Arrayed against each other, it seems possible to separate the effects of
age and metallicity, in the mean.
- 3/2 constant-index
slope described in
Appendix C, a few (the Balmer indices) are
relatively age sensitive, with
log(Age) /
log Z
- 1/2 to -1, while
others, notably, a feature called Fe4668 whose main contributor is
really molecular carbon, are relatively metal sensitive, with
log(Age) /
log Z
-5
(Worthey 1994).
Arrayed against each other, it seems possible to separate the effects of
age and metallicity, in the mean.
To derive an abundance gradient in an elliptical galaxy, one compares
observed colors or line strengths with model predictions, often assuming
a constant age throughout the galaxy. For instance,
Franx & Illingworth (1990)
find a mean color gradient in 17 elliptical galaxies of
(U-R)
/ log r =
-0.23 ± 0.03 mag per decade in radius. Entering the
Worthey (1994)
models at age 12 Gyr, one finds that a change of 0.15 dex in Z
gives the required
(U-R), so the
gradient assuming constant age is
log Z /
log R =
-0.15 dex per decade. The same number is reached by considering the
B-R gradient. Because of the very steep surface brightness
dropoff of elliptical galaxies, projection effects are small and usually
neglected. The steep dropoff also means that long-slit spectroscopy
usually only reaches to 0.5-1.0 Re (the
half-light radius), although color gradient studies and ultradeep
spectroscopy can reach to several Re.
Color studies and line strength studies generally give a consistent
picture of a gradient of about
log Z /
log R
-0.2 dex per
decade. There is probably a small correction to this number, however,
due to age effects. Simultaneous mean-age, mean-Z estimates using
the Balmer versus metal feature technique described above were derived
for the
González (1993) and
Mehlert et al. (1998)
samples of galaxies, about 60 early-type galaxies in a wide variety of
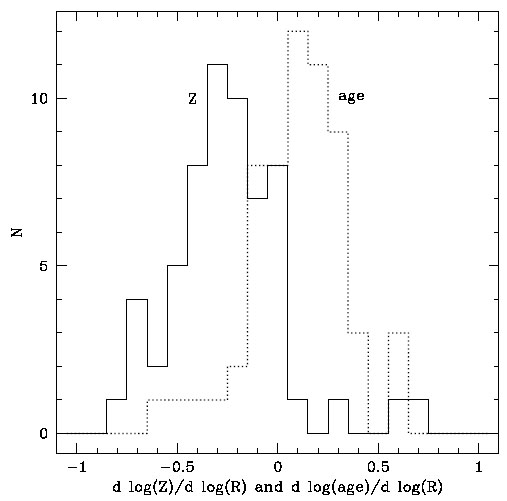
environments, and the distribution of gradients is shown in
Figure 11a. There are no trends of
gradient strength with luminosity or velocity dispersion (unlike average
Z, which is larger in larger galaxies). The average age gradient
is younger toward the center by 0.1 dex decade-1 (a few Gyrs)
and more metal rich by 0.25 dex decade-1. The scatter in the
average seems mostly due to observational error, error in correcting for
H emission
fill-in, and variation in abundance ratio mixture, and the residuals
scatter along the -3/2 age-metallicity slope
(Fig. 11b) in the way expected for
random errors in input index values.
emission
fill-in, and variation in abundance ratio mixture, and the residuals
scatter along the -3/2 age-metallicity slope
(Fig. 11b) in the way expected for
random errors in input index values.
 |
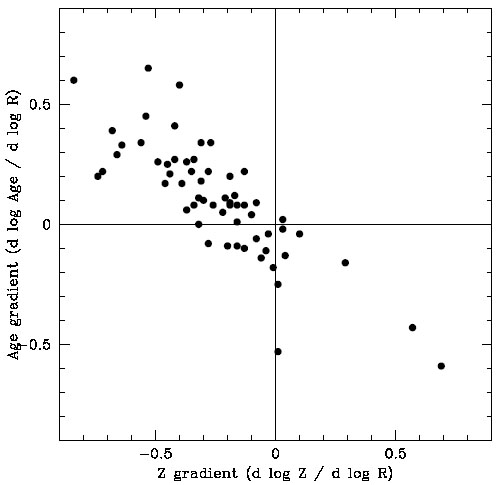 |
Figure 11. (a) Gradients
measured in early-type galaxies in two data sets:
González (1993)
nearby ellipticals and
Mehlert et al. (1998)
ellipticals and S0s in the rich Coma cluster. Gradients were derived
using the
H |
This -0.3 gradient in dex decade-1 units corresponds to about
-0.02 dex kpc-1 assuming an 8 kpc radius, which is a factor
of 3 more shallow than the gradient found for the Milky Way disk and
other nonbarred spirals (see Section
2.1). But such a value is well within the range of theoretical
models for galaxy formation. For example,
Larson's (1974)
dissipative models predict
log Z /
log R = -1,
while various
Carlberg (1984)
models range from -0.5 to 0.0. Pure stellar merging gives zero gradient,
and in fact tends to erase preexisting gradients by roughly 20% per
event, or even more via changes in radial structure of the galaxies
(White 1980).
The gradient numbers seem fairly robust and consistent from data set to data set and from model to model. What about absolute abundances? These are trickier. The nuclei of large elliptical galaxies have mean [Z / H] in the range 0.0-0.4 dex as inferred from Balmer versus metal feature diagrams. In principle, the mean abundance can be known much more precisely, but there is an additional stumbling block beyond just the inaccurate models and the complication of age-metal degeneracy. The elemental mixture in elliptical galaxies is not scaled-solar. Abundances derived from lighter element lines like Mg b or Na D are much higher than those derived from heavier Fe or Ca lines, and this is the main cause for uncertainty in the absolute abundance (Worthey 1998).