


11.3.2. Velocity Distribution
a) Line-of-Sight Velocity
Observations of neutral hydrogen are usually made with a multi-channel spectrometer so that the frequency or velocity distribution of the line radiation is also determined. Neutral hydrogen-line radiation arises from a forbidden transition, and the low-transition probability implies a small natural width of the line (5 × 10-16 Hz). The observed width of the line is therefore due to Doppler broadening (-4.74 kHz / km sec-1) at the line rest frequency of 1420.4 MHz.
The line broadening is partly due to random and thermal motions in the gas, but is mainly due to larger-scale motions of the gas. In a spiral galaxy the dominant motion is one of rotation, although expansion motions and other "peculiar" velocities are of great interest. The line-of-sight velocity of the neutral hydrogen in any portion of the galaxy can be measured as a Doppler shift, and with sufficient angular and frequency resolution we observe different Doppler shifts across the face of the galaxy. The line-of-sight velocity is interpreted in terms of the rotation, expansion, and other velocities in the galaxy, which is assumed to have a plane rotating disk geometry.
b) Isovelocity Contours
The observed line-of-sight velocity u(r,
 ) of hydrogen with
azimuthal coordinates (r,
) in a plane
galaxy inclined at an angle
i to the plane of the sky is given by
) of hydrogen with
azimuthal coordinates (r,
) in a plane
galaxy inclined at an angle
i to the plane of the sky is given by
 |
(7) |
where v0 is the systemic velocity, v(r,
) the tangential
velocity (including both the rotation of the galaxy and "peculiar"
streaming and random components),
w(r,
) a radial
velocity in the plane of the galaxy, and z(r,
) a velocity
out of the plane of the
galaxy. A complete analysis of the kinematics of a galaxy should include
all these effects. If the motion of the hydrogen in a galaxy is
one of pure rotation, then the lines of constant observed radial
velocity will be the lines
 |
(8) |
A plot of v(r) against radius r is called the
rotation curve for the
galaxy and typically has the form shown in
Figure 11.1. For a rotation
curve of this form the lines of constant observed velocity (the
isovelocity contours) will have the form shown in
Figure 11.2. Where the rotation is solid-body,
i.e., v(r)  r, the
isovelocity contours are parallel to the minor axis of the galaxy. The
region of solid-body rotation is shown enclosed by the
dashed line in Figure 11.2. Other systematic
motions of the galaxy have characteristic isovelocity contours; e.g.,
the addition of an expansion,
w(r)
r, gives isovelocity contours
in the solid-body region inclined at an angle
to the minor axis. Closed isovelocity contours are produced by the
region of the rotation curve where the rotation velocity is
decreasing with radius.
r, the
isovelocity contours are parallel to the minor axis of the galaxy. The
region of solid-body rotation is shown enclosed by the
dashed line in Figure 11.2. Other systematic
motions of the galaxy have characteristic isovelocity contours; e.g.,
the addition of an expansion,
w(r)
r, gives isovelocity contours
in the solid-body region inclined at an angle
to the minor axis. Closed isovelocity contours are produced by the
region of the rotation curve where the rotation velocity is
decreasing with radius.
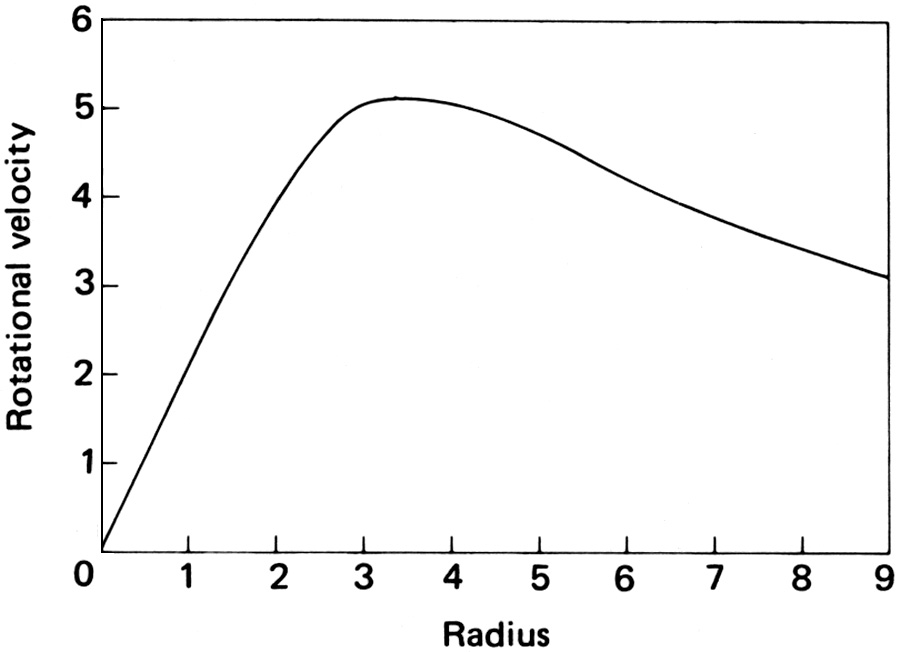 |
Figure 11.1. Model rotation curve showing (1) solid-body rotation out to 3 units radius, (2) constant velocity region between radii 3 and 4, (3) region of decreasing rotation velocity. (M. C. H. Wright.) |
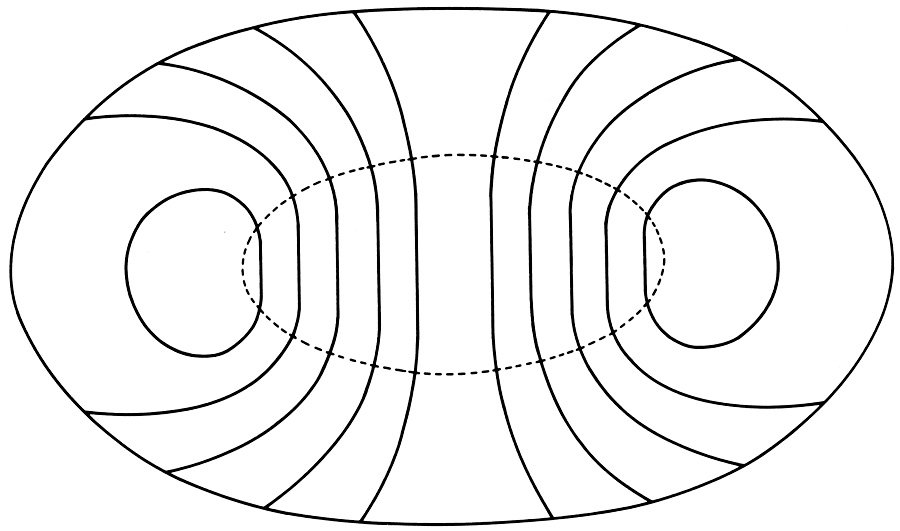 |
Figure 11.2. Isovelocity contours (lines of constant line-of-sight velocity) in a rotating galaxy. The contours are drawn at intervals of the units of velocity in Figure 11.1 The region of solid-body rotation is shown enclosed by the dashed line. [M. C. H. Wright, Astrophys. J. (1971) 166:455.] |
c) Interpretation
From the velocity information we can investigate
rotation of the galaxy and the shape of the rotation curve
the total mass and a mass distribution for the galaxy
angular momentum distribution
velocity dispersion of the gas and hence an estimate of the thickness of the neutral hydrogen layer
peculiar velocities, expansion motions
perturbations due to spiral arms, streaming motions, and density waves.
The above list has been compiled in order of increasing observational difficulty. Observation of the spiral arms and their perturbations requires the highest resolution and sensitivity and is the subject of current research.
The highest physical resolution so far obtained has been the observations of the Magellanic Clouds with the 210-foot Parkes dish, where the half-power bandwidth is equivalent to about 200 pc at the distance of the clouds. In order to obtain comparable resolution in the nearest spiral galaxies an angular resolution of the order of 1 minute arc is required and we must resort to aperture synthesis techniques. Aperture synthesis in general is discussed in Chapter 10, and its application to spectral-line work is discussed in Section 11.6, but let us first see what has been achieved with single dish measurements.