


11.4.5. Model Fitting
a) HI Distribution and Rotation Curve
The technique of taking a model distribution for a source and smoothing it by the observing beam is well known. We can do rather better with line observations, as the distribution of HI in a particular velocity range is a function of both the density and velocity distribution of the gas. For a rotating galaxy with isovelocity contours, as in Figure 11.2, observations in the different velocity channels are essentially of the regions delimited by the isovelocity contours. The shape of these is determined by the rotation curve and other motions in the galaxy. Profiles of brightness temperature versus velocity may be generated from a model for the rotation curve and the neutral hydrogen distribution. The generation of model profiles is usually performed with a digital computer and many input models can be tried. The HI distribution and rotation curve, which give profiles that most resemble the observed profiles, are to be preferred. The chief drawback to this procedure is that there must always be two multi-parameter inputs: the rotation curve and the hydrogen distribution. These interact in the generation of the model profiles and it is usually possible to get a good fit to the observed profiles with more than one input model.
b) Minor Axis Profiles
The region radiating in a small velocity range about the systemic velocity of a rotating galaxy lies close to the minor axis (see Figure 11.2). In a direction orthogonal to the minor axis the region observed may be much narrower than the beamwidth. With limited resolution the shape of the hydrogen distribution in a small velocity range about the systemic velocity (viz., the minor axis profile) is often observed to be double-peaked or flat-topped. This observation has led to the suggestion (Roberts, 1967) that the distribution of hydrogen along the minor axis is also double-peaked and that a ring-shaped distribution of hydrogen, as in M31, is a common feature of the HI distribution in external galaxies. Consideration of Figure 11.2 shows that the shape of the minor axis profile is a function of both the distribution of HI along the minor axis and the shape of the isovelocity contours defining the minor axis region observed.
In M31 the neutral hydrogen distribution along the minor axis is double-peaked in the integrated neutral hydrogen distribution as well as in a small velocity range centered on the systemic velocity, and the description of the overall distribution of HI as a ring is a good one. M33 has a similar double-peaked minor axis profile in a small velocity range, but this is due to the shape of the isovelocity contours, and the HI distribution is really rather flat-topped. It remains to be seen from higher-resolution observations whether a ring is a good general description of the neutral hydrogen distribution in external galaxies (see Section 7.3).
c) Mass Derivations
In many cases the internal motion of an external galaxy is well approximated by a rotation law, v(r), and if we assume that the rotating galaxy is in dynamic equilibrium under self-gravitation, it is possible to derive a mass distribution from the rotation law. Several schemes have been used for calculating a mass distribution from the rotation curve. Most mass derivations based on optically measured rotation curves have used a mass model of the form of concentric spheroids developed by Burbidge, Burbidge, and Prendergast (1963). The mass is calculated by fitting a polynomial to the rotation curve, and substituting this into the equation for the equilibrium of the concentric spheroids to derive the density as a function of radius. Use of a polynomial with more than five or six terms produces unrealistic oscillations in the rotation curve, and the calculated mass distribution is not particularly sensitive to the number of terms in the polynomial used.
Many spiral galaxies are highly flattened and a variable density disk is a good model. Model rotation curves developed by Brandt and Belton (1962) have been much used in neutral hydrogen work, as they may be inverted to give a mass distribution directly. The necessary functions are well tabulated (Brandt and Scheer, 1965). The Brandt curves are characterized by a maximum rotation velocity Vmax at a radius Rmax, also called the turn-over radius. There is also a shape parameter n, which gives more sharply peaked rotation curves for larger values of n. The general equation is
 |
(9) |
The only physical feature of the Brandt curve is that, at large radii; the galaxy must appear as a point mass and the rotation velocity is then Keplerian. There is very little evidence from observations as to the nature of actual rotation curves beyond the turnover radius, but the Brandt curve is often a good fit up to this point, and the derived mass within this radius compares well with masses derived by fitting concentric spheroids. The total mass derived by extrapolating the observed rotation curve along the best-fitting Brandt curve is, however, much larger, and we have the rather unsatisfactory result that much of the mass of the galaxy lies beyond the observed region. Fitting a rotation curve model to a number of galaxies does offer a convenient and standard way of comparing the mass and derived quantities of these galaxies, but some care must be exercised in interpreting the results. The best procedure seems to be to quote a mass out to some standard radius such as the Holmberg (1958) radius. The angular momentum distribution may also be derived from the fitted density distribution, and this is of interest with respect to theories of galaxy formation from a condensing cloud of gas. The Brandt curve is characterized by only three parameters: Rmax, Vmax, and the shape parameter n. Since the angular momentum scales as Rmax2 Vmax3 and the mass as Rmax Vmax2, we must avoid comparing any two parameters such as mass and angular momentum derived by fitting the Brandt curve, as they will then be mathematically correlated, independent of any real physical correlation between mass and angular momentum. Indeed, in the absence of real correlation between mass and angular momentum a graph of Rmax2 Vmax3 versus Rmax Vmax2 has a slope determined by the relative dispersion in the distributions of Rmax and Vmax. Measurements of angular momentum are also rather unsatisfactory, as most of the angular momentum lies beyond the observed rotation curve.
For those 21-cm observations where
there is insufficient angular resolution to
measure the radius of maximum rotation
velocity directly, a mass may still be obtained
by estimating Vmax from the width of the
profile and Rmax from the optical size of the
galaxy. Figure 11.3(b) is a plot of
Rmax / a [where a is the
Holmberg (1958)
diameter] for 21 galaxies for which the rotation curves
have been determined optically from long-slit spectroscopy of HII
regions. The ratio is not a function of the morphological type, and
the histogram is quite sharply peaked with
Rmax
 0.1a. If
Rmax cannot be measured,
then we can estimate it as one-tenth a in order to obtain a mass
estimate. For irregular galaxies a mass may be estimated from the virial
theorem (e.g.,
Volders and Högbom,
1961);
the mass will be
0.1a. If
Rmax cannot be measured,
then we can estimate it as one-tenth a in order to obtain a mass
estimate. For irregular galaxies a mass may be estimated from the virial
theorem (e.g.,
Volders and Högbom,
1961);
the mass will be
 |
(10) |
where a is the diameter of the galaxy, G is the gravitational constant, Vr.m.s. is estimated from the width of the velocity profile, and k is a constant of order unity which depends upon an assumed model for the density and velocity distribution.
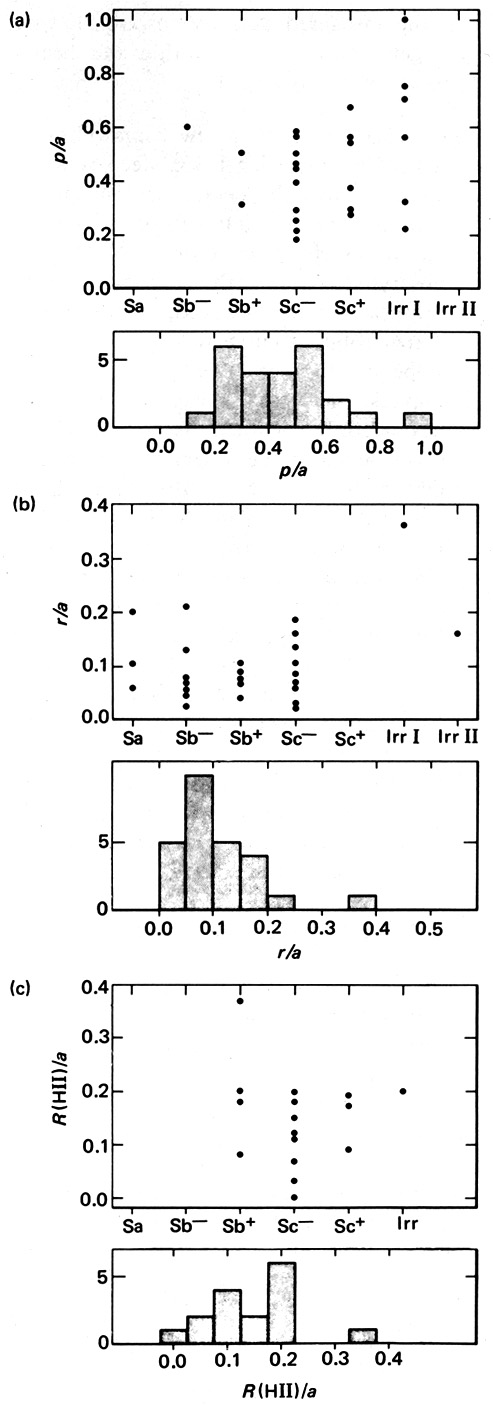 |
Figure 11.3. Plot against morphological type
of galaxy and a histogram for (a) turnover radius,
|
d) Noncircular Velocities
Noncircular velocities are apparent as departures of the isovelocity contours from symmetry about the major and minor axes. In particular we are interested in analyzing the isovelocity contours for expanding hydrogen and for streaming motions in the vicinity of spiral arms as predicted by the density wave theory (see Chapter 4 and also Lin, Yuan, and Shu, 1969). Analysis of these effects may be made by fitting the isovelocity contours with a model rotation curve, V = V(r), and a set of parameters such as the systemic velocity, inclination, position angle, and rotation center.
The fitting for V(r) can take place over the whole plane of the galaxy, with a higher weight given to points near the major axis. Having obtained the best-fit rotation curve, model isovelocity contours can then be subtracted from the observed isovelocity contours to give the residual velocity field. Examination of the residuals then shows, more clearly the systematic noncircular or "peculiar" velocities. It should be noted that the isovelocity contours and the residual velocity field are velocities weighted by the hydrogen distribution within the beam area, and particular care must be taken in interpreting the results. The effect of beam smoothing is to bias the measured velocity toward that of hydrogen concentrations within the beam. Two examples may be given
A galaxy which is a few beamwidths in diameter and which has a steep rotation curve toward the center has isovelocity contours drawn at intervals of the velocity resolution with a separation less than the observing beamwidth. Broad-frequency profiles will be observed, and the estimated rotation curve will have a smaller slope than the true curve.
Suppose that the hydrogen distribution has the form of spiral arms with separation rather less than the observing beamwidth. Observations between the spiral arms where there is not much HI will give a beam-smoothed profile with a velocity biased toward that of the nearest spiral arm. There is usually a gradient in the rotation velocity, and observations on the inner and outer edges of the spiral hydrogen concentration will yield velocities biased in opposite directions. We may be looking for just this sort of velocity, perturbation resulting from streaming motions near spiral arms! Clearly, caution must be exercised in drawing conclusions from observed peculiar velocities.
 /a, for
galaxies observed by
/a, for
galaxies observed by