Copyright © 2003 by Annual Reviews. All rights reserved
| Annu. Rev. Astron. Astrophys. 2003. 41:
191-239 Copyright © 2003 by Annual Reviews. All rights reserved |


Evidence for dark halos in elliptical galaxies from stellar
velocities has been slow in coming
because of uncertainties in geometrical projection
and in the anisotropy of stellar orbits as well as the
inherent faintness of starlight beyond
Re where dark matter may begin to dominate the potential.
Nevertheless, recent optical studies have revealed
the presence of outwardly increasing
mass to light ratios consistent with a dark matter
contribution that is appreciable but
not dominant at ~ Re
(Saglia et al 1992;
Carollo et al 1995;
Rix et al 1997;
Gerhard et al 1998;
Emsellem et al. 1999;
Matthias & Gerhard
1999).
Gravitational lensing of background objects provides
independent evidence for a dark matter component
in elliptical galaxies and their surrounding groups (e.g.
Keeton 2001).
Fortunately, the X-ray emitting hot gas allows
in principle a much better determination of the total mass profile
to very large radii. Accurate mass determinations require
high quality X-ray observations of the gas density and (especially)
temperature profiles plus reasonable assurance that the gas
is in hydrostatic equilibrium and that gas pressure dominates.
The mass distribution can only be determined for rather massive E galaxies,
LB
 LB,
crit, in which the X-ray emission is dominated by gas,
not stellar sources.
LB,
crit, in which the X-ray emission is dominated by gas,
not stellar sources.
Hydrostatic equilibrium requires that
systematic and turbulent hot gas velocities are subsonic.
Information moving at the sound speed in the hot gas in E galaxies,
( P
/
P
/
 )1/2
~ 513 TkeV1/2 km s-1,
crosses the optical half-light radius Re ~ 10 kpc
in only tsc ~ 2 × 10⁷ years.
If the hot gas is losing energy by radiative losses,
it should flow inward at a rate
)1/2
~ 513 TkeV1/2 km s-1,
crosses the optical half-light radius Re ~ 10 kpc
in only tsc ~ 2 × 10⁷ years.
If the hot gas is losing energy by radiative losses,
it should flow inward at a rate
 ~ Lx,
bol / (5kT / 2 µmp)
~ Lx,
bol / (5kT / 2 µmp)
 1.5
M
1.5
M yr-1 where
Lx, bol ~ 5 × 1041 erg s-1 is
a typical X-ray bolometric luminosity for massive E galaxies. Using
ne(Re) ~ 0.01 cm-3 for a
typical hot gas density
at Re, the systematic inflow velocity,
u ~ /
ne(Re)
mp 4
yr-1 where
Lx, bol ~ 5 × 1041 erg s-1 is
a typical X-ray bolometric luminosity for massive E galaxies. Using
ne(Re) ~ 0.01 cm-3 for a
typical hot gas density
at Re, the systematic inflow velocity,
u ~ /
ne(Re)
mp 4 Re2 ~ 5 km s-1,
is highly subsonic, consistent with hydrostatic equilibrium.
Less is known about the magnitude of turbulent motions
in the hot gas, but radial velocities of diffuse optical emission lines
from gas at T ~ 104 K in the central regions
of E galaxies (e.g.
Caon et al. 2000),
vturb
Re2 ~ 5 km s-1,
is highly subsonic, consistent with hydrostatic equilibrium.
Less is known about the magnitude of turbulent motions
in the hot gas, but radial velocities of diffuse optical emission lines
from gas at T ~ 104 K in the central regions
of E galaxies (e.g.
Caon et al. 2000),
vturb
 150 km
s-1, suggest subsonic motion,
assuming this cold gas comoves with the local hot gas.
150 km
s-1, suggest subsonic motion,
assuming this cold gas comoves with the local hot gas.
The condition for hydrostatic equilibrium
dPtot / dr = - GM
/
r2 allows a direct determination of the total mass of
stars and dark matter within each radius:
 |
(1) |
where mp is the proton mass and µ = 0.61 is the molecular weight for full ionization. In addition to the gas pressure P, an additional non-thermal turbulent, magnetic or cosmic ray pressure Pnt may be present. In ellipticals containing strong radio sources Faraday depolarization at radio frequencies provides direct evidence for Pnt (e.g. Garrington et al. 1988; Garrington & Conway 1991), but this pressure is usually ignored in most E galaxy mass determinations. Non-radiating relativistic protons may also be present (e.g. Fabian et al. 2002a), so it is unclear if Pnt can always be ignored.
The total integrated mass M(r)
can be estimated by using the average temperature within some radius.
Loewenstein & White
(1999)
studied the ratio of the dimensional coefficients in the equation above,
 =
<
=
< >2
/ (k <T> / µ mp) where
<>2
>2
/ (k <T> / µ mp) where
<>2
 GM(r) /
r is the central stellar velocity dispersion (assumed to be
isotropic) and <T> is the
mean hot gas temperature within 6Re determined from
fits to the thermal X-ray spectrum. Loewenstein & White considered
an optically complete sample of over 40 E galaxies
(Davis & White 1996).
Using accurate stellar mass profiles normalized to the fundamental plane,
they determined that
0.75 - 1.2
should be expected in the absence of dark matter. The observed values,
0.6 ± 0.1,
clearly require a dark matter component. Both
the gas and the dark matter are hotter than the central stars.
Loewenstein & White conclude that dark matter
increases from stellar values at the origin
<
GM(r) /
r is the central stellar velocity dispersion (assumed to be
isotropic) and <T> is the
mean hot gas temperature within 6Re determined from
fits to the thermal X-ray spectrum. Loewenstein & White considered
an optically complete sample of over 40 E galaxies
(Davis & White 1996).
Using accurate stellar mass profiles normalized to the fundamental plane,
they determined that
0.75 - 1.2
should be expected in the absence of dark matter. The observed values,
0.6 ± 0.1,
clearly require a dark matter component. Both
the gas and the dark matter are hotter than the central stars.
Loewenstein & White conclude that dark matter
increases from stellar values at the origin
< V>
V>
 <M /
LV>
10h70
M /
LV,
to <V>
22h70
M /
LV,
within 6Re. Extended dark halos
are a common property of all bright ellipticals.
<M /
LV>
10h70
M /
LV,
to <V>
22h70
M /
LV,
within 6Re. Extended dark halos
are a common property of all bright ellipticals.
For a few bright E galaxies both
T(r) and ne(r) can be determined and
Equation (1) can be solved directly for the total
mass profile M(r).
Figure 2a shows the electron density profile
in NGC 4472, a well-observed massive E1 galaxy
and the brightest galaxy in the Virgo cluster,
at an assumed distance of d = 17 Mpc (ne
d-1/2). The hot gas density profiles
may have small flattened cores but vary as
ne
r-p at larger radii with
p 1 - 1.5, so
the gas mass increases outward. Using Einstein HRI data
Trinchieri, Fabbiano &
Canizares (1986)
showed that the optical and X-ray surface brightness profiles
are almost identical for three bright Virgo ellipticals, NGC 4649, NGC 4636 and NGC 4472, so that
ne2. This remarkable
result is illustrated again in Figure 2a where
ne
*1/2 is seen to hold
over a wide range in galactic radius.
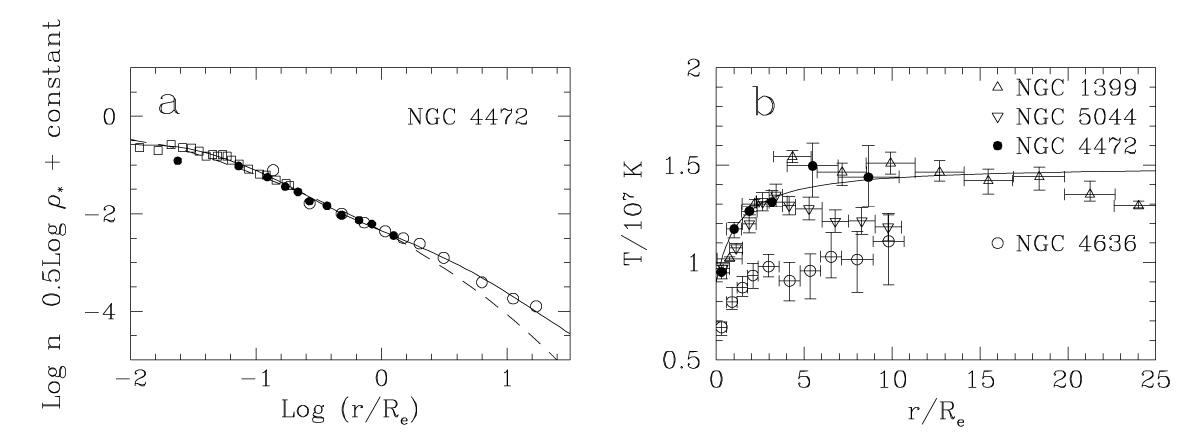 |
Figure 2. (2a Left panel:) The
observed and azimuthally averaged electron density profile
n(r) in NGC 4472 is shown as a function
of radius normalized to the effective radius
Re = 8.57 kpc at distance d = 17 Mpc. The
observations are from Einstein
(Trinchieri, Fabbiano,
& Canizares 1986)
(filled circles) and ROSAT
(Irwin & Sarazin
1996)
(open circles); for the inner region
we have Abel-inverted Chandra surface brightness data from
Loewenstein et
al. (2001)
(open squares) and normalized them to previous observations.
The solid line is an analytic fit to the observations.
The dashed line is the square root of the stellar density
|
Figure 2b shows the hot gas temperature profiles
for several massive E galaxies. The temperature in these group-dominant
E galaxies rises from a minimum value near
the galactic center to a maximum at several Re and,
if the gas is sufficiently extended, is either
uniform or slowly decreasing beyond
(Brighenti & Mathews
1997
and references therein), sometimes extending to
10Re. (In cluster-centered E galaxies the temperature
continues to rise to the cluster gas temperature.)
The radiative cooling time at constant pressure in the hot gas
in NGC 4472 is quite short, tcool
108rkpc1.2 yrs,
but greater than the dynamical time
tdyn
3 × 10⁶ rkpc0.85 yrs.
The entropy factor Tn-2/3 for NGC 4472 is
relatively flat within r ~ 0.55 kpc, suggesting local heating
(David et al. 2001),
then increases monotonically with radius, Tn-2/3
6.5 ×
107rkpc0.8712
K cm2, as required for convective stability.
Recent Chandra observations often show surface brightness
fluctuations and cavities, sometimes extending to ~ Re,
that suggest deviations from hydrostatic equilibrium.
The total mass Mtot(r) profile for NGC 4472 determined
from Equation (1) (with Pnt = 0 and
data from Figs. 2a and 2b)
is plotted in Figure 3a.
Also shown is the stellar mass distribution
M*(r) based on a de Vaucouleurs profile
*,deV(r) (total mass:
M*t = 7.26 × 10¹¹
M;
effective radius: Re = 1.733' = 8.57 kpc) with a core
(r) = *,deV(rb)(r /
rb)-0.90 within the break radius
rb = 2.41" = 200 pc
(Gebhardt et al. 1996;
Faber et al. 1997).
It is remarkable that the total mass
Mtot(r) in Figure 3a
determined with Equation (1) agrees quite well with the de Vaucouleurs
mass profile in the range
0.1 r /
Re
1.
The best fitting stellar profile corresponds to a mass to light ratio of
B
M /
LB 7,
slightly less than
B =
9.2 determined for NGC 4472 from
axisymmetric stellar models near the galactic core
(van der Marel 1991).
This consistency of X-ray and stellar mass profiles suggests that the
stellar mass to light ratio in NGC 4472 does not change greatly with galactic
radius in 0.1
r / Re
1
(Brighenti & Mathews
1997a;
also for NGC 720:
Buote et al. 2002a).
As X-ray observations improve we expect that they
will provide much information on the stellar mass to light ratio for
r
Re. At small radii
r
0.03Re in NGC 4472,
Mtot is less than M*.
This may indicate some additional non-thermal pressure
Pnt in this region or a deviation from hydrostatic
equilibrium. Like most bright E galaxies, NGC 4472 contains a faint double lobe radio source
that extends to ~ 0.5Re
(Ekers & Kotanyi
1978).
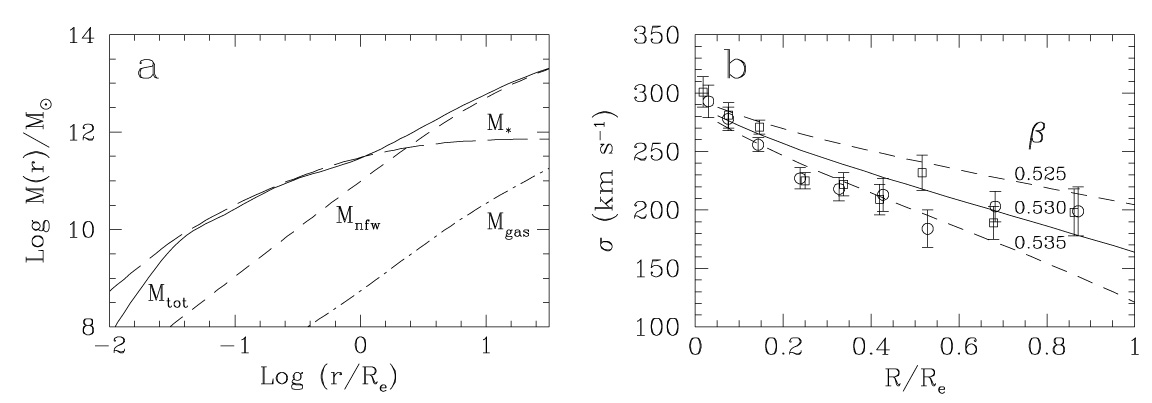 |
Figure 3. (3a Left panel:) The total
mass Mtot(r)
for NGC 4472 (solid line) is found from Equation (1)
with Pnt = 0 using the solid line approximations
to the X-ray observations in Figure 2.
The total mass of hot gas Mgas(r)
(dot-dashed line) is relatively small.
The stellar mass profile M*(r)
(long dashed line) is based
on a de Vaucouleurs plus core profile with mass to light ratio
|
The dark halo mass
clearly dominates in Figure 3a for
r
Re where Mtot(r)
rises sharply above the de Vaucouleurs profile (e.g.
Brighenti & Mathews 1997a;
Kronawitter et
al. 2000).
The shape of the dark halo is consistent with an NFW halo
(Navarro, Frenk &
White 1996),
but the virial mass
of the dark halo surrounding NGC 4472 and its mass profile
are poorly determined in part due to
uncertainties in the hot gas temperature beyond several
Re. In addition, the X-ray image of NGC 4472 is asymmetric for
r
2.5Re, as seen in Figure 4,
apparently because of its motion through the more extended Virgo cluster
gas or possibly due to its interaction with the nearby dwarf
irregular galaxy UGC 7636
(Irwin & Sarazin
1996;
1997).
(See Fabbiano et
al. 1992
for an atlas of similar figures.) In spite of these problems,
the azimuthally averaged gas density profile around NGC 4472
is similar to the mean profile of about 10
other bright E galaxies out to at least 18Re.
 |
Figure 4. Contours show a combined ROSAT HRI and PSPC X-ray image of NGC 4472 superimposed on an optical image from the Digital Sky Survey (Irwin & Sarazin 1996). |
In non-spherical E galaxies,
the existence of massive dark halos can be inferred directly
from the X-ray image independent of the hot gas temperature
profile - providing the gas is in hydrostatic equilibrium
and rotation has little influence on the potential. For example,
Buote & Canizares
(1998)
find that the X-ray isophotes of the E4 galaxy NGC 3923 have ellipticity
 x = 0.15
± 0.05, which is significantly
less than that in the R-band,
R = 0.30.
Although the gravitational potential is always more spherical than
the mass distribution, Buote & Canizares show that this
x
can be understood only if the confining mass is
greater and more extended
than any mass distribution proportional to the optical light (also:
Buote et al. 2002a).
Furthermore, the dark mass must have an ellipticity
dm = 0.35
- 0.66 greater than the optical image.
Not only is this an elegant method to detect dark matter (see also
Buote & Canizares
1996;
1997),
it serves as a warning, generally ignored, that the dark
matter may not be distributed in a quasi-spherical fashion.
x = 0.15
± 0.05, which is significantly
less than that in the R-band,
R = 0.30.
Although the gravitational potential is always more spherical than
the mass distribution, Buote & Canizares show that this
x
can be understood only if the confining mass is
greater and more extended
than any mass distribution proportional to the optical light (also:
Buote et al. 2002a).
Furthermore, the dark mass must have an ellipticity
dm = 0.35
- 0.66 greater than the optical image.
Not only is this an elegant method to detect dark matter (see also
Buote & Canizares
1996;
1997),
it serves as a warning, generally ignored, that the dark
matter may not be distributed in a quasi-spherical fashion.
While the hot gas in NGC 4472, NGC 4649 and NGC 720
appears to be in hydrostatic equilibrium in the stellar potential
in 0.1 r /
Re
1, this
circumstance may not be universal. For example, in NGC 4636
Brighenti & Mathews
(1997a)
found that the total mass M(r) profile found from Equation (1)
(with Pnt = 0) intersects the stellar
mass M*(r) (using
B =
10.7) with no slope change whatsoever. Brighenti & Mathews argued
that this insensitivity may be due to a magnetic field,
B ~ 100 µG,
(Pnt
B2 / 8) at
r ~ 0.1Re, so that the missing
(Pnt / P)(d log Pnt /
d log P) term in Equation (1) would account for the
discrepancy. Cosmic rays or energetic turbulence would serve equally well.
In fact the Chandra X-ray image of NGC 4636 shows that the
hot gas is strongly agitated for
r
Re
(Jones et al. 2002),
consistent with a breakdown in hydrostatic equilibrium. Alternatively,
in reconciling the total mass M(r) of NGC 4636 from X-ray data,
Loewenstein &
Mushotzky (2002)
reduced the contribution of the stars by
lowering the stellar mass to light ratio to
B
< 5.4 (at d = 17 Mpc) which is very much less than values
determined for NGC 4636 from stellar velocities:
B =
10.7
(van der Marel 1991)
or B =
11.3
(Kronawitter et
al. 2000)
(both at d = 17 Mpc).
The shape of the stellar velocity ellipsoid
(r)
can also be estimated directly from X-ray observations, especially for
very massive E galaxies that are approximately spherical. Here
(r) =
1 - t2
/ r2
depends on
r and
t =
 =
=  ,
the velocity dispersions in the radial and transverse
directions. Combining the Jeans Equation for the radial stellar velocity
dispersion
r with the
equation for hydrostatic equilibrium in the gas we find
,
the velocity dispersions in the radial and transverse
directions. Combining the Jeans Equation for the radial stellar velocity
dispersion
r with the
equation for hydrostatic equilibrium in the gas we find
 |
(2) |
where
c2 = kT / µ mp is
the isothermal sound speed. From Figure 2a for
NGC 4472 we see that
0.5(d log * / d log r) = d
log /
d log r = - 1.18 fits over
-1.3
log(r / Re)
0.
The gas temperature variation is approximately linear over this region,
c2(r)
4135(rkpc + 30) (km s-1)2
(Figure 2b).
If is
assumed to be constant, Equation (2) can be solved analytically for
r2(r)
and the line of sight stellar velocity
dispersion as a function of projected radius
(;R)
can be found by integration (e.g.
Binney & Mammon
1982).
The resulting (;R),
when compared with stellar velocity dispersion observations
in Figure 3b, suggests
= 0.530
± 0.005, somewhat higher than that of
Kronawitter et
al. (2000)
who use different velocity data. Conversely, if
(r) is
known securely from stellar data, Equation (2) can be used to determine
the gas temperature profile c2(r).