


Perhaps the most significant development of the decade in the field of extragalactic GCs was the discovery that the color distributions of GC systems are typically bimodal. Indeed, color bimodality is the basic paradigm of modern GC studies. Nearly every massive galaxy studied to date with sufficiently accurate photometry has been shown to have a bimodal GC color distribution, indicating two subpopulations of GCs. In principle, these color differences can be due to age or metallicity differences or some combination of the two. Due to the well-known degeneracy between age and metallicity (e.g., Worthey 1994), the cause of this bimodality is not readily deduced from optical colors alone. Nonetheless, the significance of the finding was immediately recognized. The presence of bimodality indicates that there have been at least two major star-forming epochs (or mechanisms) in the histories of most - and possibly all - massive galaxies. Subsequent spectroscopic studies (see Section 4) have shown that color bimodality is due principally to a metallicity difference between two old subpopulations.
With our "bimodality-trained" modern eyes, we can see evidence of the phenomenon in the B - I CFHT imaging of NGC 4472 in Couture, Harris & Allwright (1991) and C - T1 CTIO imaging of NGC 5128 by Harris et al. (1992). However, the first groups to propose bimodality (or "multimodality") were Zepf & Ashman (1993) for NGC 4472 and NGC 5128 and Ostrov, Geisler, & Forte (1993) for NGC 1399 (in fact, using the Harris et al. and Couture et al. colors). Observations of the GC systems of galaxies throughout the 1990s provided mounting evidence that bimodality was ubiquitous in massive galaxies. The primary catalyst of this research was the advent of the Hubble Space Telescope (HST). The Wide Field and Planetary Camera 2 (WFPC2) provided the spatial resolution and accurate photometry needed to reliably identify GC candidates in galaxies as distant as the Virgo Cluster at 17 Mpc (e.g., Whitmore et al. 1995). At this distance, GCs (with typical half-light radii of 2-3 pc ~ 0.03-0.04") are resolvable with HST and their sizes are measurable with careful modeling of the PSF. This drove down the contamination from background galaxies and foreground stars to low levels and was a substantial improvement over multi-band optical photometry from the ground.
Among the larger and more comprehensive photometric studies using HST/WFPC2 were Gebhardt & Kissler-Patig (1999), Larsen et al. (2001a) and Kundu & Whitmore (2001a). Using data from the HST archive, Gebhardt & Kissler-Patig showed that bimodality was a common phenomenon. However, since the imaging was shallow for many of the galaxies in their sample, they failed to find bimodality in ~ 50% of their 50 galaxies. Taking advantage of deeper data, Larsen et al. (2001a) and Kundu & Whitmore (2001a) found statistically significant bimodality in most of their sample galaxies, the majority of which were of early-type. Galaxies that were tentatively identified as unimodal in these studies were later, with improved photometric precision, shown to conform to the bimodality "rule". Indeed, it is important to note that no massive elliptical (E) galaxy has been convincingly shown to lack GC subpopulations. An absence of metal-poor GCs was suggested for both NGC 3311 (Secker et al. 1995) and IC 4051 (Woodworth & Harris 2000), and an absence of metal-rich GCs for NGC 4874 (Harris et al. 2000). However, HST/WFPC2 imaging of NGC 3311 (Brodie, Larsen, & Kissler-Patig 2000) revealed a healthy subpopulation of metal-poor GCs. It is now clear that the WFPC2 photometry of the Coma E IC 4051 was not deep enough to securely argue for a uni- or bimodal fit. Finally, the NGC 4874 result was due to a photometric zeropoint error (W. Harris, private communication). The discovery of a massive E which indeed lacked a metal-poor (or metal-rich) subpopulation would be important, but so far no such instances have been confirmed.
The majority of these HST studies were carried out in V- and I-equivalent bands. This choice was largely driven by efficiency considerations (shorter exposure times needed to reach a nominal S/N), despite the fact that other colors, such as B - I, offer much better metallicity sensitivity for old stellar populations.
It has been known for some time that the GC system of the Milky Way is also bimodal. The presence of GC subpopulations in the Milky Way was codified by Zinn (1985; see also Armandroff & Zinn 1988) who identified two groups of GCs. "Halo" GCs are metal-poor, non-rotating (as a system), and can be found at large galactocentric radii. "Disk" GCs are metal-rich and form a flattened, rotating population. Later work on the spatial and kinematic properties of the metal-rich GCs by Minniti (1995) and Côté (1999) identified them with the Milky Way bulge rather than its disk (as we shall see below, this association seems to hold for other spirals as well, although see the discussion in Section 3.3). In addition to their sample of early-type galaxies, Larsen et al. (2001a) also discussed the GC systems of the Milky Way and NGC 4594 in some detail, pointing out that the locations of the GC color peaks in these spirals were indistinguishable from those of massive early-type galaxies.
The blue (metal-poor) and red (metal-rich) peaks in massive early type
galaxies typically occur at V - I = 0.95 ± 0.02 and
1.18 ± 0.04
(Larsen et al. 2001a).
These colors correspond to
[Fe/H] ~ -1.5 and -0.5 for old GCs (or a bit more metal-rich, depending
on the metallicity scale and color-metallicity relation adopted). Figure 1 shows a histogram of the V - I
colors of GCs in the Virgo gE M87, which clearly shows bimodality
(Larsen et al. 2001a).
However, the peak locations are not exactly the
same for all galaxies. Before GC bimodality was discovered,
van den Bergh (1975)
suggested and
Brodie & Huchra (1991)
confirmed a correlation between the mean color/metallicity of GC systems
and the luminosity of their parent galaxies.
Brodie & Huchra (1991)
also showed that the slope of this relation was very similar to the relation
connecting galaxy color and galaxy luminosity, but the GC relation was
offset toward lower metallicities by about 0.5 dex. They noted that the
similarity in slope suggests a close connection between the physical
processes responsible for the formation of both GCs and
galaxies. Subsequently, a correlation between the color of just the
metal-rich GCs and host galaxy luminosity was found by
Forbes et al. (1997),
Larsen et al. (2001a),
and Forbes & Forte
(2001).
The slope of this relation was again found to be similar to that of the
color-magnitude relation for early-type galaxies (V - I
 -0.018
MV), suggesting that metal-rich GCs formed along with
the bulk of the field stars in their parent galaxies.
-0.018
MV), suggesting that metal-rich GCs formed along with
the bulk of the field stars in their parent galaxies.
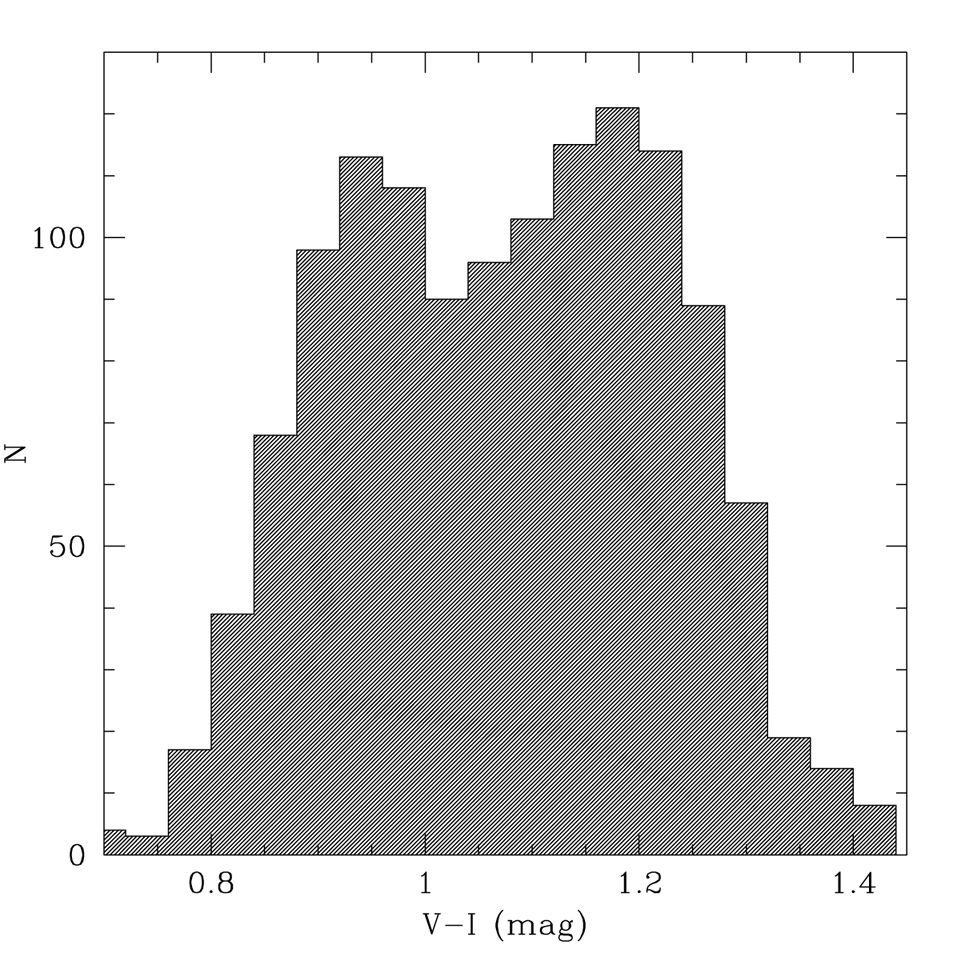 |
Figure 1. V - I color histogram of GCs in the Virgo gE M87, showing clear bimodality (Larsen et al. 2001; figure from data courtesy of S. Larsen). |
With the exception of
Larsen et al. (2001a),
little or no correlation
between the color of the metal-poor GCs and host galaxy
luminosity was reported in these studies, although
Burgarella et al. (2001)
and Lotz, Miller, & Ferguson (2004)
suggested such a
relation might be present, but only for the dwarf galaxies. Larsen et
al. found a shallow relation for the metal-poor GCs in their sample of
17 massive early-type galaxies, albeit at moderate
(3 ) statistical
significance.
Strader, Brodie, &
Forbes (2004a)
compiled and reanalyzed
high-quality data from the literature and found a significant (>
5) correlation for
metal-poor GCs, extending from massive Es to dwarfs over ~ 10 magnitudes
in galaxy luminosity. The relation is indeed relatively shallow
(V - I
-0.009 MV, or Z ~ L0.15),
making it difficult to detect, especially in heterogeneous data
sets. This same slope was confirmed by
Strader et al. (2006) and
Peng et al. (2006)
for early-type galaxies in Virgo. Figure 2
shows [Fe/H] vs. MB for both subpopulations; the
GC peaks are taken from
Strader et
al. (2004a) and
Strader et al. (2006)
and have been converted from V - I and g - z
using the relations of
Barmby et al. (2000) and
Peng et al. (2006),
respectively. These data, together with ancillary information about the
GC systems, are compiled in Table 1. The true
scatter at fixed MB is unclear, since the
observational errors vary among galaxies, and there may an additional
component due to small differences between the V - I and
g - z color-metallicity relations. The cutoff in the
metal-rich relation at MB ~ -15.5 primarily reflects
the magnitude limit of the sample; it may continue to fainter
magnitudes, although many such galaxies have only metal-poor GCs. The
remarkable inference to be drawn from Figure 2
is that the peak metallicities of both subpopulations are determined
primarily by galaxy luminosity (or mass) across the entire spectrum of
galaxy types.
) statistical
significance.
Strader, Brodie, &
Forbes (2004a)
compiled and reanalyzed
high-quality data from the literature and found a significant (>
5) correlation for
metal-poor GCs, extending from massive Es to dwarfs over ~ 10 magnitudes
in galaxy luminosity. The relation is indeed relatively shallow
(V - I
-0.009 MV, or Z ~ L0.15),
making it difficult to detect, especially in heterogeneous data
sets. This same slope was confirmed by
Strader et al. (2006) and
Peng et al. (2006)
for early-type galaxies in Virgo. Figure 2
shows [Fe/H] vs. MB for both subpopulations; the
GC peaks are taken from
Strader et
al. (2004a) and
Strader et al. (2006)
and have been converted from V - I and g - z
using the relations of
Barmby et al. (2000) and
Peng et al. (2006),
respectively. These data, together with ancillary information about the
GC systems, are compiled in Table 1. The true
scatter at fixed MB is unclear, since the
observational errors vary among galaxies, and there may an additional
component due to small differences between the V - I and
g - z color-metallicity relations. The cutoff in the
metal-rich relation at MB ~ -15.5 primarily reflects
the magnitude limit of the sample; it may continue to fainter
magnitudes, although many such galaxies have only metal-poor GCs. The
remarkable inference to be drawn from Figure 2
is that the peak metallicities of both subpopulations are determined
primarily by galaxy luminosity (or mass) across the entire spectrum of
galaxy types.
| Name | Galaxy Typea | Environmentb | MBc | MP colord | MR colord | MP [Fe/H]e | MR [Fe/H]e | Colorf | SNg | SN Refsh |
| (mag) | (mag) | (mag) | (dex) | (dex) | ||||||
| NGC 4472 | core E | Virgo C | -21.9 | 0.951 | 1.411 | -1.32 | -0.17 | g - z | 3.6 ± 0.6 | 1 |
| NGC 1399 | core E | Fornax C | -21.8 | 0.952 | 1.185 | -1.37 | -0.39 | V - I | 5.1 ± 1.2 | 2 |
| NGC 3309 | core(?) E | Hydra C | -21.6 | 0.947 | 1.134 | -1.39 | -0.60 | V - I | ... | ... |
| NGC 4486 | core E | Virgo C | -21.5 | 0.953 | 1.390 | -1.31 | -0.21 | g - z | 14.1 ± 1.5 | 3 |
| NGC 3311 | core(?) E | Hydra C | -21.5 | 0.929 | ... | -1.47 | ... | V - I | ... | ... |
| NGC 4406 | core E | Virgo C | -21.5 | 0.986 | 1.145 | -1.23 | -0.56 | V - I | 3.5 ± 0.5 | 1 |
| NGC 4649 | core E | Virgo C | -21.4 | 0.964 | 1.424 | -1.26 | -0.14 | g - z | 4.1 ± 1.0 | 4 |
| NGC 524 | S0 | N524 G | -21.4 | 0.980 | 1.189 | -1.25 | -0.37 | V - I | ... | ... |
| NGC 4374 | core E | Virgo C | -21.2 | 0.927 | 1.322 | -1.45 | -0.33 | g - z | 1.6 ± 0.3 | 5 |
| NGC 5322 | core(?) E | N5322 G | -21.2 | 0.942 | ... | -1.41 | ... | V - I | ... | ... |
| NGC 4594 | S0/Sa | N4594 G | -21.2 | 0.939 | 1.184 | -1.43 | -0.39 | V - I | 2.1 ± 0.3 | 1 |
| NGC 4365 | core E | Virgo C | -21.1 | 0.891 | 1.232 | -1.63 | -0.50 | g - z | ... | ... |
| NGC 7619 | core(?) E | Pegasus C | -21.1 | 0.973 | ... | -1.28 | ... | V - I | ... | ... |
| NGC 7562 | core(?) E | Pegasus C | -20.9 | 0.920 | ... | -1.51 | ... | V - I | ... | ... |
| NGC 2768 | S0 | N2768 G | -20.8 | 0.919 | ... | -1.51 | ... | V - I | ... | ... |
| NGC 4621 | transition E | Virgo C | -20.7 | 0.927 | 1.305 | -1.45 | -0.36 | g - z | ... | ... |
| NGC 5813 | core E | N5846 G | -20.6 | 0.935 | ... | -1.44 | ... | V - I | 5.7 ± 1.8 | 6 |
| IC 1459 | core E | I1459 G | -20.6 | 0.955 | ... | -1.36 | ... | V - I | ... | ... |
| NGC 3115 | S0 | N3115 G | -20.4 | 0.922 | 1.153 | -1.50 | -0.52 | V - I | ... | ... |
| NGC 4494 | power E | N4565 G | -20.4 | 0.901 | 1.128 | -1.59 | -0.63 | V - I | ... | ... |
| NGC 4552 | core E | Virgo C | -20.3 | 0.951 | 1.334 | -1.32 | -0.31 | g - z | ... | ... |
| NGC 253 | Sc | Sculptor G | -20.3 | 0.912 | ... | -1.54 | ... | V - I | ... | ... |
| NGC 1404 | core(?) E | Fornax C | -20.3 | 0.938 | 1.170 | -1.43 | -0.45 | V - I | 2 ± 0.5 | 7 |
| M31 | Sb | Local G | -20.2 | 0.912 | ... | -1.54 | ... | V - I | 1.3 | 8 |
| NGC 3379 | core E | Leo I G | -20.1 | 0.964 | 1.167 | -1.32 | -0.47 | V - I | 1.2 ± 0.3 | 1 |
| NGC 4278 | core E | N4631 G | -20.1 | 0.908 | ... | -1.56 | ... | V - I | ... | ... |
| NGC 4473 | power E | Virgo C | -20.0 | 0.942 | 1.310 | -1.37 | -0.35 | g - z | ... | ... |
| NGC 3608 | core E | N3607 G | -20.0 | 0.923 | ... | -1.49 | ... | V - I | ... | ... |
| NGC 1400 | S0 | Eridanus G | -19.9 | 0.951 | 1.164 | -1.38 | -0.48 | V - I | ... | ... |
| Milky Way | Sbc | Local G | -19.9 | 0.898 | ... | -1.60 | ... | V - I | 0.7 | 8 |
| NGC 1023 | S0 | N1023 G | -19.7 | 0.912 | 1.164 | -1.54 | -0.48 | V - I | ... | ... |
| NGC 4291 | core E | N4291 G | -19.6 | 0.940 | ... | -1.42 | ... | V - I | ... | ... |
| NGC 3384 | S0 | Leo I G | -19.5 | 0.942 | 1.208 | -1.41 | -0.29 | V - I | ... | ... |
| NGC 3607 | S0 | N3607 G | -19.5 | 0.939 | 1.099 | -1.43 | -0.75 | V - I | ... | ... |
| NGC 1427 | power E | Fornax C | -19.4 | 0.940 | 1.153 | -1.42 | -0.52 | V - I | 3.4 ± 0.6 | 9 |
| NGC 4478 | power E | Virgo C | -19.2 | 0.882 | 1.195 | -1.68 | -0.56 | g - z | ... | ... |
| NGC 4434 | power E | Virgo C | -19.2 | 0.911 | 1.179 | -1.53 | -0.59 | g - z | ... | ... |
| NGC 3377 | power E | Leo I G | -19.2 | 0.936 | 1.103 | -1.44 | -0.74 | V - I | ... | ... |
| NGC 4564 | S0 | Virgo C | -19.0 | 0.935 | 1.263 | -1.40 | -0.44 | g - z | ... | ... |
| NGC 4387 | power E | Virgo C | -19.0 | 0.859 | 1.112 | -1.79 | -0.72 | g - z | ... | ... |
| NGC 4660 | S0 | Virgo C | -18.7 | 0.923 | 1.320 | -1.47 | -0.33 | g - z | ... | ... |
| NGC 247 | Sd | Sculptor G | -18.7 | 0.908 | ... | -1.56 | ... | V - I | ... | ... |
| NGC 4733 | power E | Virgo C | -18.6 | 0.918 | 1.131 | -1.52 | -0.62 | V - I | ... | ... |
| NGC 4550 | S0 | Virgo C | -18.6 | 0.883 | 1.145 | -1.66 | -0.56 | V - I | ... | ... |
| NGC 4489 | S0 | Virgo C | -18.5 | 0.900 | 1.260 | -1.58 | -0.44 | g - z | ... | ... |
| NGC 4551 | power E | Virgo C | -18.5 | 0.890 | 1.219 | -1.64 | -0.52 | g - z | ... | ... |
| M33 | Scd | Local G | -18.4 | 0.900 | ... | -1.59 | ... | V - I | ... | ... |
| NGC 4458 | power E | Virgo C | -18.4 | 0.892 | 1.223 | -1.63 | -0.51 | g - z | ... | ... |
| NGC 55 | Sm | Sculptor G | -18.3 | 0.892 | ... | -1.63 | ... | V - I | ... | ... |
| IC 3468 | dE | Virgo C | -18.1 | 0.925 | 1.130 | -1.46 | -0.68 | g - z | 1.1 | 10 |
| NGC 300 | Sd | Sculptor G | -18.1 | 0.892 | ... | -1.63 | ... | V - I | ... | ... |
| NGC 4482 | dE | Virgo C | -18.1 | 0.884 | 1.065 | -1.67 | -0.80 | g - z | 1.6 | 10 |
| LMC | dIrr | Local G | -18.0 | 0.890 | ... | -1.63 | ... | V - I | 0.8 | 8 |
| NGC 3599 | S0 | Leo I G | -17.6 | 0.872 | 1.112 | -1.71 | -0.70 | V - I | ... | ... |
| IC 3019 | dE | Virgo C | -17.2 | 0.864 | 1.093 | -1.77 | -0.75 | g - z | 1.8 | 10 |
| IC 3381 | dE | Virgo C | -17.1 | 0.897 | 1.168 | -1.60 | -0.61 | g - z | 5.2 | 10 |
| IC 3328 | dE | Virgo C | -17.1 | 0.905 | 1.114 | -1.56 | -0.71 | g - z | 0.9 | 10 |
| NGC 4318 | dE | Virgo C | -17.1 | 0.884 | 1.182 | -1.67 | -0.59 | g - z | 0.7 | 10 |
| IC 809 | dE | Virgo C | -17.1 | 0.864 | 1.129 | -1.77 | -0.68 | g - z | 3.3 | 10 |
| IC 3653 | power E | Virgo C | -17.1 | 0.851 | N | -1.84 | N | g - z | 0.6 | 10 |
| IC 3652 | dE | Virgo C | -16.9 | 0.879 | 1.173 | -1.69 | -0.60 | g - z | 3.7 | 10 |
| VCC 543 | dE | Virgo C | -16.9 | 0.794 | N | -2.13 | N | g - z | 0.4 | 10 |
| IC 3470 | dE | Virgo C | -16.9 | 0.938 | 1.138 | -1.39 | -0.67 | g - z | 5.0 | 10 |
| NGC 4486b | power E | Virgo C | -16.8 | 0.920 | 1.126 | -1.51 | -0.64 | V - I | ... | ... |
| IC 3501 | dE | Virgo C | -16.8 | 0.872 | 1.177 | -1.73 | -0.60 | g - z | 5.3 | 10 |
| IC 3442 | dE | Virgo C | -16.8 | 0.837 | 1.089 | -1.91 | -0.76 | g - z | 0.8 | 10 |
| VCC 437 | dE | Virgo C | -16.7 | 0.894 | 1.042 | -1.61 | -0.85 | g - z | 1.1 | 10 |
| IC 3735 | dE | Virgo C | -16.7 | 0.848 | 1.198 | -1.85 | -0.56 | g - z | 1.6 | 10 |
| SMC | dIrr | Local G | -16.7 | 0.919 | ... | -1.51 | ... | V - I | 1.2 | 8 |
| IC 3032 | dE | Virgo C | -16.6 | 0.861 | 1.169 | -1.78 | -0.61 | g - z | 0.9 | 10 |
| VCC 200 | dE | Virgo C | -16.6 | 0.931 | 1.101 | -1.42 | -0.74 | g - z | 0.5 | 10 |
| IC 3487 | dE | Virgo C | -16.5 | 0.824 | 1.086 | -1.97 | -0.76 | g - z | 1.2 | 10 |
| IC 3509 | power E | Virgo C | -16.4 | 0.869 | 1.071 | -1.74 | -0.79 | g - z | 7.3 | 10 |
| VCC 1895 | dE | Virgo C | -16.3 | 0.818 | 1.071 | -2.01 | -0.79 | g - z | 1.6 | 10 |
| IC 3647 | dE | Virgo C | -16.2 | 0.845 | N | -1.87 | N | g - z | 1.0 | 10 |
| IC 3383 | dE | Virgo C | -16.2 | 0.834 | 1.056 | -1.92 | -0.82 | g - z | 4.6 | 10 |
| VCC 1627 | power E | Virgo C | -16.2 | 0.755 | N | -2.33 | N | g - z | 0.5 | 10 |
| IC 3693 | power E | Virgo C | -16.2 | 0.779 | 1.177 | -2.21 | -0.60 | g - z | 1.0 | 10 |
| IC 3101 | dE | Virgo C | -16.1 | 0.842 | 1.134 | -1.88 | -0.67 | g - z | 4.9 | 10 |
| IC 798 | power E | Virgo C | -16.1 | 0.854 | N | -1.82 | N | g - z | 4.6 | 10 |
| IC 3779 | dE | Virgo C | -16.1 | 0.880 | 1.060 | -1.69 | -0.81 | g - z | 2.0 | 10 |
| IC 3635 | dE | Virgo C | -16.0 | 0.898 | N | -1.59 | N | g - z | 5.0 | 10 |
| VCC 1993 | dE | Virgo C | -16.0 | 0.851 | N | -1.84 | N | g - z | 0.3 | 10 |
| IC 3461 | dE | Virgo C | -15.8 | 0.919 | 1.142 | -1.49 | -0.66 | g - z | 12.1 | 10 |
| VCC 1886 | dE | Virgo C | -15.8 | 0.877 | N | -1.70 | N | g - z | 1.5 | 10 |
| IC 3602 | dE | Virgo C | -15.7 | 0.855 | N | -1.82 | N | g - z | 1.1 | 10 |
| NGC 205 | dE | Local G | -15.6 | 0.922 | N | -1.50 | N | V - I | 3 | 8 |
| VCC 1539 | dE | Virgo C | -15.6 | 0.898 | 1.039 | -1.59 | -0.87 | g - z | 9.5 | 10 |
| VCC 1185 | dE | Virgo C | -15.6 | 0.890 | 1.077 | -1.64 | -0.78 | g - z | 6.3 | 10 |
| IC 3633 | dE | Virgo C | -15.5 | 0.884 | N | -1.67 | N | g - z | 3.3 | 10 |
| IC 3490 | dE | Virgo C | -15.4 | 0.858 | 1.136 | -1.80 | -0.67 | g - z | 7.3 | 10 |
| VCC 1661 | dE | Virgo C | -15.3 | 0.838 | 1.130 | -1.90 | -0.68 | g - z | 2.3 | 10 |
| NGC 185 | dE | Local G | -14.8 | 0.882 | N | -1.67 | N | V - I | 4.6 | 8 |
| NGC 6822 | dIrr | Local G | -14.7 | 0.850 | ... | -1.80 | ... | V - I | 1.2 | 11 |
| NGC 147 | dE | Local G | -14.3 | 0.807 | N | -1.98 | N | V - I | 3.6 | 8 |
| WLM | dIrr | Local G | -13.9 | 0.910 | N | -1.55 | N | V - I | 1.7 | 8 |
| Sagittarius | dSph | Local G | -12.8 | 0.871 | ... | -1.71 | ... | V - I | 18.1 | 11 |
| Fornax | dSph | Local G | -12.6 | 0.858 | N | -1.77 | N | V - I | 28.8 | 8 |
aPower/Core E: Ellipticals
with power-law or cored center surface brightness distributions. NGC
4621 is a transition between the two groups. The galaxies with (?) are
not formally classified - the division has been made between
core/power-law Es at MB = -20
(Faber et al. 1997;
Kormendy et al. 2006).
Classifications are from
Kormendy et al. (2006,
and private communication) for Virgo galaxies,
Faber et al. (1997)
for many early-type galaxies, and NED for the remainder. The term dE (dwarf
elliptical) is often used for all non-star forming galaxies with
MB
|
||||||||||
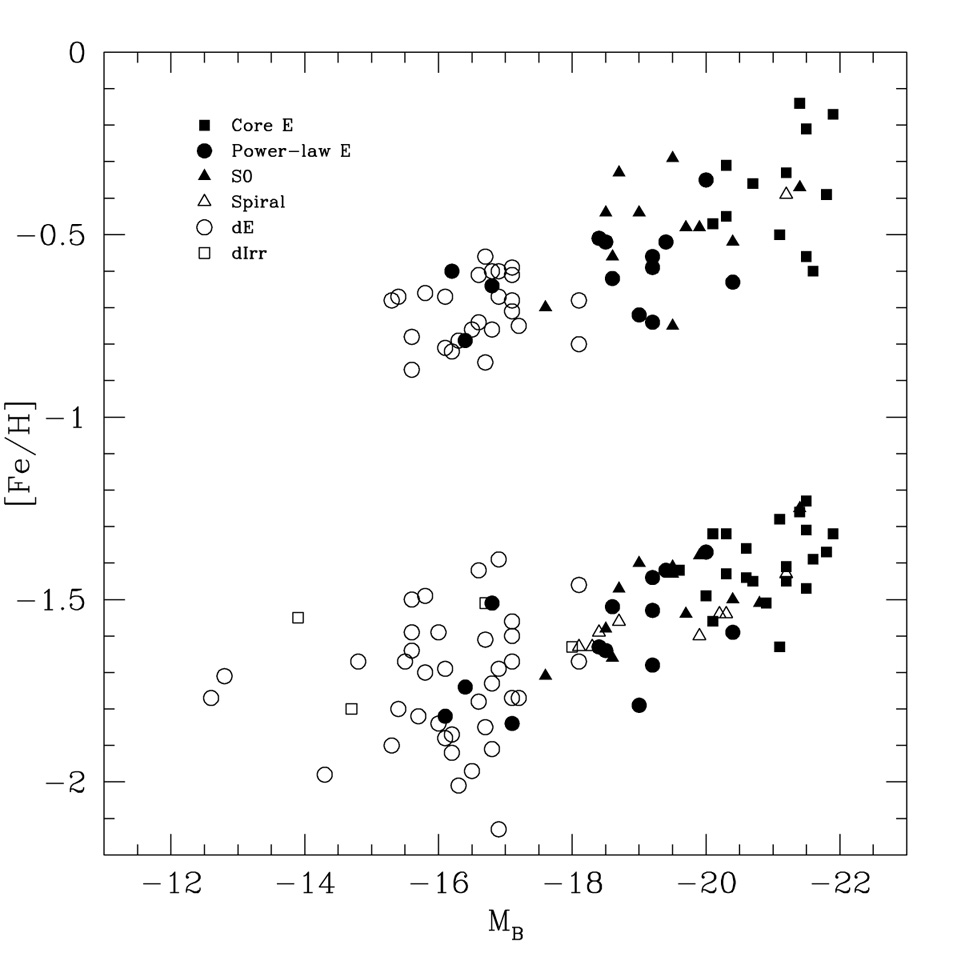 |
Figure 2. Peak GC metallicity vs. galaxy luminosity (MB) for metal-poor and metal-rich GCs in a range of galaxies. The points are from Strader et al. (2004a) and Strader et al. (2006) and have been converted from V - I and g - z to [Fe/H] using the relations of Barmby et al. (2000) and Peng et al. (2006), respectively. Galaxy types are indicated in the figure key; classifications are in Table 1. Linear relations exist for both subpopulations down to the limit of available data. |
Using their new color-metallicity transformation between g - z and [Fe/H], Peng et al. found Z ~ L0.25 for metal-rich GCs, which is also consistent with the previous estimates of the slope already noted. The color-metallicity relation appears to be quite nonlinear, as discussed below. Thus, even though the slopes of the metal-poor and metal-rich relations are significantly different in the GC color-galaxy luminosity plane, they are similar in the GC metallicity-galaxy luminosity plane (see Figure 2). In Section 11 we discuss the constraints on galaxy formation implicit in these relations.
The Advanced Camera for Surveys (ACS) on HST has significantly advanced our understanding of the color distributions of GC systems, offering a wider field of view and improved photometric accuracy compared to WFPC2. Three large studies of Es utilizing HST/ACS have recently been published. As mentioned above, Peng et al. (2006) and Strader et al. (2006) studied the GC systems of early-type galaxies (ranging from dwarf to giant) using g and z data taken as part of the ACS Virgo Cluster Survey (Côté et al. 2004). Peng et al. investigated all 100 (E and S0) galaxies, while Strader et al. focused solely on the ellipticals (Es). Harris et al. (2006) used BI ACS photometry to analyze GCs in eight "BCGs", galaxies which are among the brightest in their respective groups or clusters.
These studies resulted in several new discoveries. First, a correlation
was found between color and luminosity for individual metal-poor
GCs in some giant Es (the "blue tilt"; see Figure 3). This is the first
detection of a mass-metallicity relation for GCs. The blue tilt was
found by Strader et al. in the Virgo giant Es (gEs) M87 and NGC 4649 and
by Harris et al. in their sample, although the interpretations of the
findings differ. The mass-metallicity relation for individual metal-poor
GCs may argue for self-enrichment. Strader et al. speculated that these
metal-poor GCs were able to self-enrich because they once possessed dark
matter halos that were subsequently stripped (see also discussion in Section 12). The M87 data are well-fit by a
relation equivalent to Z
M0.48 over the magnitude range 20 < z <
23.2, where the turnover of the GC luminosity function (GCLF) is at
z ~ 23. Harris et al. found a similar relation (Z
M0.55)
but suggested that the trend was only present at bright luminosities
(MI
 -9.5 to -10,
corresponding to z
22 in the Strader et
al. Virgo dataset). The CMDs in Strader et al. for M87 and NGC 4649
appear consistent with a continuation of the correlation to magnitudes
fainter than z = 22, but do not strongly distinguish between the
two interpretations. We do know that the blue tilt phenomenon is not
confined to galaxies in high density environments or even just to E
galaxies. It has recently been reported for NGC 4594
(Spitler et al. 2006),
a luminous Sa galaxy that lies in a loose group. Curiously,
the Virgo gE NGC 4472 (also studied by Strader et al.) shows no
evidence for the blue tilt. If this lack of a tilt is confirmed with
better data, it will be a strong constraint on any potential "universal"
model for explaining the phenomenon in massive galaxies. The Milky Way
itself does not show evidence for the tilt, but this could be due to the
small number of metal-poor GCs (~ 100) compared to massive galaxies or
to the inhomogeneity of metallicities and integrated photometry in
current catalogs.
-9.5 to -10,
corresponding to z
22 in the Strader et
al. Virgo dataset). The CMDs in Strader et al. for M87 and NGC 4649
appear consistent with a continuation of the correlation to magnitudes
fainter than z = 22, but do not strongly distinguish between the
two interpretations. We do know that the blue tilt phenomenon is not
confined to galaxies in high density environments or even just to E
galaxies. It has recently been reported for NGC 4594
(Spitler et al. 2006),
a luminous Sa galaxy that lies in a loose group. Curiously,
the Virgo gE NGC 4472 (also studied by Strader et al.) shows no
evidence for the blue tilt. If this lack of a tilt is confirmed with
better data, it will be a strong constraint on any potential "universal"
model for explaining the phenomenon in massive galaxies. The Milky Way
itself does not show evidence for the tilt, but this could be due to the
small number of metal-poor GCs (~ 100) compared to massive galaxies or
to the inhomogeneity of metallicities and integrated photometry in
current catalogs.
Harris et al. (2006) found that the metal-poor GC sequence lay slightly redward of, but parallel to, the luminosity-color sequence of dE nuclei from Lotz et al. (2004). The dE data were converted from V - I to B - I for this comparison, and a small zero-point shift in the color conversion would line these up. Indeed, in Figure 3 the M87 z vs. g - z color-magnitude diagram is shown superimposed with dE nuclei from Strader et al. (2006). Here the sequence of dE nuclei falls right on top of the bright end of the metal-poor GC sequence, although the dE sequence is broader. This could be consistent with a scenario in which at least some of the metal-poor GCs in gEs are stripped nuclei of dEs. Since the size range of dE nuclei overlaps that of GCs, it may be impossible to ascertain the provenance of every luminous cluster.
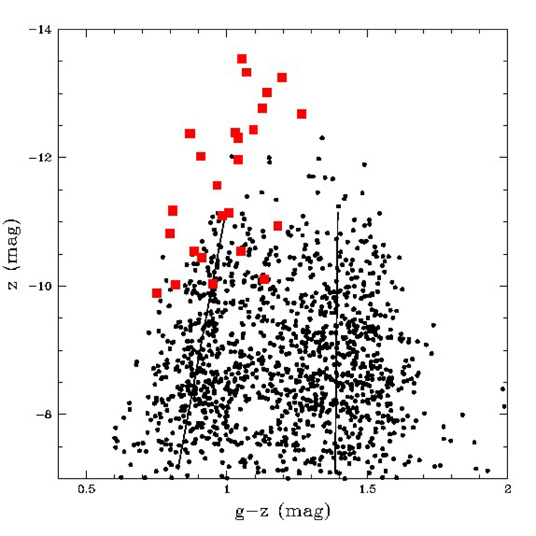 |
Figure 3. z vs. g - z color-magnitude diagram for M87 GCs (black circles) and Virgo dE nuclei (red squares) from Strader et al. (2006). A correlation between color and luminosity for the bright metal-poor GCs is apparent (the "blue tilt"). The solid lines are fitted linear relations. The dE nuclei are generally consistent with the sequence of metal-poor GCs, but extend to higher luminosities and have a larger spread in color. |
Harris et al. suggested that the tilted metal-poor GC relation caused the metal-poor and metal-rich peaks to merge at the brightest GC luminosities, turning a bimodal distribution into a nominally unimodal one. By contrast, Strader et al. argued that at these high luminosities there is a separate population of objects with larger-than-average sizes and a range of colors, spanning the metal-poor to metal-rich subpopulations. Indeed, Harris et al. find that ~ 20-30 of the brightest objects in the nearest galaxy in their sample, NGC 1407 (at ~ 21 Mpc), appear to be extended with respect to normal GCs. The size measurements suggest that there is something qualitatively different about (at least) a subset of the brightest GCs, which has also been recognized in NGC 1399 (Dirsch et al. 2003) and NGC 4636 (Dirsch, Schuberth, & Richtler 2005). The sizes and luminosities of the bright intermediate-color objects in these galaxies suggest a relation to the "ultra-compact dwarf" galaxies (UCDs) discovered in both the Fornax and Virgo clusters (e.g., Phillips et al. 2001).
The second significant finding was that the color dispersion of the
metal-rich GCs is nearly twice as large as that of the metal-poor
GCs. Peng et al., Strader et al., and Harris et
al. reported essentially the same dispersions in the color distributions
of both subpopulations. However, Peng et al. and Harris et al. adopted
different color-metallicity relations, and these led to divergent
conclusions about the metallicity distributions of these
populations. Harris et al. fit a linear relation between
B - I and metallicity using Galactic GCs. This has the
advantage of being independent of stellar population models but the
disadvantage of being yoked to the metallicity distribution of Galactic
clusters. There are no low-reddening Galactic GCs with [Fe/H]
 -0.5, so the empirical relation is unconstrained at these metallicities,
and the data are poorly fit by a linear relation in the very metal-poor
regime. Peng et al. used a piecewise linear relation broken at
g - z = 1.05 or [Fe/H] ~ -0.8. This utilized GCs in the
Galaxy, M87, and NGC 4472 with both g - z colors and
spectroscopic metallicities (these are still ultimately tied to the
Galactic GC [Fe/H] scale). The qualitative effect was to "flatten" the
relation at low metallicities compared to a linear fit - so small color
changes correspond to large metallicity changes - and to "steepen" it at
high metallicities.
-0.5, so the empirical relation is unconstrained at these metallicities,
and the data are poorly fit by a linear relation in the very metal-poor
regime. Peng et al. used a piecewise linear relation broken at
g - z = 1.05 or [Fe/H] ~ -0.8. This utilized GCs in the
Galaxy, M87, and NGC 4472 with both g - z colors and
spectroscopic metallicities (these are still ultimately tied to the
Galactic GC [Fe/H] scale). The qualitative effect was to "flatten" the
relation at low metallicities compared to a linear fit - so small color
changes correspond to large metallicity changes - and to "steepen" it at
high metallicities.
Consequently, Peng et al. found the metal-poor GCs to have a larger
metallicity dispersion than the metal-rich GCs: 68% half-width [Fe/H]
intervals of ~ 0.6 dex and 0.3 dex for the metal-poor and metal-rich GCs
in massive galaxies, respectively (these were derived from a
nonparametric analysis and thus are not exactly equivalent to a
1 dispersion for a normal
distribution). By contrast, Harris et al. deduced mean
1 dispersions of ~ 0.3
dex and
0.4 dex, and noted that the metal-poor and metal-rich subpopulations in
the Galaxy have = 0.34
dex and = 0.16 dex. The
relative widths of the two Galaxy subpopulations are more consistent
with the Peng et al. results, though smaller in an absolute
sense. However, even if the metallicity dispersion in the metal-poor GCs
is larger, the absolute metallicity spread is much smaller. The
implications of these differences for the enrichment histories of the
two subpopulations remain to be seen.
It seems clear from the new Galactic GC data in Peng et al. that a single linear fit is not optimal, but the exact form of the relation at metallicity extremes is poorly constrained. Clearly, identifying the correct form of the g - z to [Fe/H] conversion (and, indeed, conversions for other colors) is essential, since the metallicity spreads in individual subpopulations have important implications for the formation and assembly histories of GC systems. The different color dispersions for the subpopulations also indicate that it is necessary to use heteroscedastic (unequal variance) fits in mixture modeling. Homoscedastic fits will give systematic errors in the peak values, but may be the best option for systems with few GCs. Another important effect of nonlinear color-metallicity relations is that bimodal color distributions can be enhanced or even created from metallicity distributions that are not strongly bimodal (Richtler 2006; Yoon, Yi, & Lee 2006).
The last principal finding in these new studies, reported in both Strader et al. and Peng et al., is that many dEs have metal-rich GC subpopulations. Their colors are consistent with an extrapolation of the GC color-galaxy luminosity relation for massive galaxies, though the fraction of metal-rich GCs tends to be smaller in dEs than in massive Es. Peng et al. found that the median fraction of metal-rich GCs is ~ 0.15-0.2 in dEs and rises steeply towards more luminous galaxies. Some of this increase is due to the different radial distributions of the two subpopulations; the HST/ACS data preferentially sample the more centrally-concentrated metal-rich GCs. Global fractions of metal-rich GCs in massive Es are likely to be closer to 0.3-0.4 (Rhode & Zepf 2004). The changing fraction of metal-rich GCs with galaxy luminosity, combined with the correlations of GC colors with galaxy luminosity for both subpopulations, fully explains the classic correlation between the mean color/metallicity of a GC system and parent galaxy luminosity (Brodie & Huchra 1991). The overall slope actually measured depends on how the sample is defined. If HST data are used, the metal-rich GCs will be overrepresented and the steep slope of the metal-rich GC relation will dominate the overall relation.
These new results suggest that considerable undiscovered detail may still be hidden in GC color distributions. Intensive use should be made of HST/ACS while it is still operational. It is likely to be the best instrument available for the next ~ 15 years for studying the optical color distributions of GCs.
Once bimodality was observed to be a common phenomenon, several scenarios were presented to explain it. In this section, we briefly describe the leading scenarios (see also the review of West et al. 2004), but leave detailed discussion until Section 11. The major merger model of Ashman & Zepf (1992) has the distinction of being the only model to predict bimodality before it was observed. This model evolved from early work suggesting that E galaxies formed in gas-rich major mergers of disk galaxies (Toomre & Toomre 1972; Toomre 1977; Schweizer 1987). Burstein (1987) and Schweizer (1987) suggested that new GCs might be formed in large quantities during the merger process. Ashman & Zepf (1992) and Zepf & Ashman (1993) developed this idea into a predictive model in which the metal-poor GCs are donated by the progenitor spirals and the metal-rich GCs are formed in the gas-rich merger. This model gained enormous support when new HST observations of merging galaxies found large numbers of young massive star clusters (YMCs). The most famous example of this is the Antennae (Whitmore & Schweizer 1995), but several other cases were discovered in the early-to-mid 1990s (e.g., NGC 1275, Holtzman et al. 1992; NGC 7252, Miller et al. 1997). The interpretation of these YMCs as "proto-GCs" was widely adopted. Determining the extent to which these YMCs have properties consistent with "normal" old GCs is still an active area of research; see Section 8 below.
Several problems with the major merger model were pointed out in Forbes, Brodie & Grillmair (1997), who showed that, when examined in detail, the number and color distributions of GCs in massive Es appeared to be inconsistent with the merger model predictions (see Section 11.1.1). They instead suggested that bimodality could arise as a consequence of a multi-phase dissipational collapse. In their scenario, the metal-poor globular clusters were formed in gaseous fragments during the earliest phases of galaxy formation. GC formation was then truncated at high redshift and resumed after a dormant period of a few Gyr. During this second phase the metal-rich GCs and the bulk of the galaxy field stars were formed. Forbes et al. discussed this truncation process in terms of feedback, with gas being expelled from the early cluster-forming clumps. Such gas would later cool and recollapse into the more fully-formed galactic gravitational potential until the local conditions were conducive to renewed star formation. Subsequently, Santos (2003) suggested cosmic reionization as the mechanism for truncating metal-poor GC formation. Although some details differ, similar "in situ" models for GC formation were also presented by Harris & Pudritz (1994) and Harris, Harris, & Poole (1999).
In the accretion scenario of
Côté, Marzke
& West (1998),
the metal-rich GCs were formed in situ in a massive seed galaxy, while
the metal-poor GCs were acquired in the dissipationless accretion of
neighboring lower-mass galaxies (see also
Hilker 1998;
Hilker, Infante, &
Richtler 1999,
and earlier work by
Muzzio 1987
and references therein). This works in principle because of the
long-known relation between the mean metallicity of the GC system and
the mass of the host galaxy
(van den Bergh 1975;
Brodie & Huchra 1991;
Forbes & Forte 2001).
Stripping of GCs without the accompanying galaxy light is also a
possibility in dense clusters. Côté et al.
(1998;
2000;
2002)
explored the accretion model in detail using Monte Carlo
simulations. They showed that the bimodality observed in massive
galaxies can be reproduced provided that (i) each galaxy has an
intrinsic "zero-age" population of GCs, whose metallicity increases with
the galaxy's mass, and (ii) the primordial galactic mass function for
low-mass galaxies is a rather steep power law (with  ~ -2). The slope is
consistent with the halo mass functions predicted by standard
~ -2). The slope is
consistent with the halo mass functions predicted by standard
 CDM models, but
much steeper than that actually observed for
present-day low-mass galaxies (but see
Section 11.2).
CDM models, but
much steeper than that actually observed for
present-day low-mass galaxies (but see
Section 11.2).
This triad of scenarios: major merger, in situ/multiphase, and accretion, were the ones most frequently discussed to explain bimodality throughout the last decade. In a very real sense, the distinctions between these models could be blurred by placing the merger or accretion events at high redshift and allowing for significant gas in the components, so to some extent the debate was semantic. Indeed, Harris (2003) noted that these scenarios could be reclassified in terms of the amount of gas involved. Nevertheless, we have presented these scenarios here to give some context for the discussion of observations that follows.