


While lopsidedness is seen to be a ubiquitous phenomenon (Section 1), various methods are used in the literature to define the asymmetry in disk galaxies. We list and compare below the details, such as the definitions, the size of the sample studied, the tracer used (near-IR radiation from old stars, and 21 cm emission from the HI gas etc.) There is no consensus so far as to what is the definition for lopsidedness as well as what constitutes lopsidedness (or the threshold). Obviously this has to be done if say the percentage of galaxies showing lopsidedness as per the different criteria are to be compared. At the end of Section 2.1, we recommend the use of a standard criterion for lopsidedness as well as the threshold that could be adopted by future workers.
The disk lopsidedness in spiral galaxies has been studied in two different tracers - HI, the atomic hydrogen gas studied in the outer parts of disks, and the near-IR radiation from the inner/optical disks which traces the old stellar component of the disks. The lopsidedness was historically first detected in the HI, which we now realize is due to a higher lopsided amplitude at large radii. Hence we follow the same, chronological order in the summary of observations given next.
2.1. Morphological lopsidedness
2.1.1. Morphological lopsidedness in HI gas
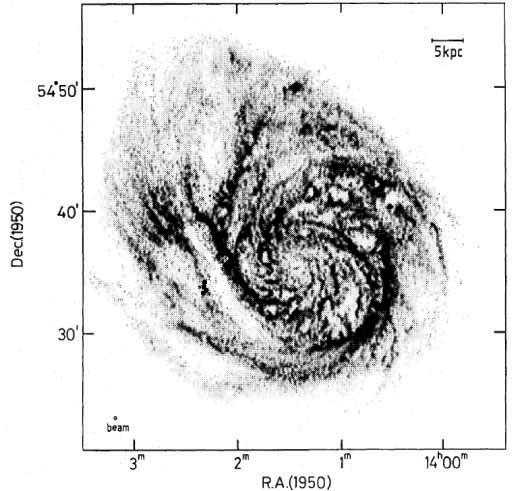
The asymmetric distribution of HI in M101 was noted in the early HI observations (Beale & Davies 1969). This phenomenon was first highlighted by Baldwin et al. (1980), who studied galaxies with highly asymmetric spatial extent of atomic hydrogen gas distributions in the outer regions in the two halves of a galaxy, such as M101 and NGC 2841 (see Fig. 1 here). This paper mentions the asymmetric distribution of light and HI in spiral galaxies such as M101. Quantitatively, they looked at the HI distribution in the four prototypical galaxies, namely, M101, NGC 891, NGC 4565, NGC NGC 2841. They defined a galaxy to be "lopsided" in which the galaxy is more extended on one side than the other, and where the projected density of HI on the two sides of the galaxy is at least 2:1 , and in which the asymmetry persists over a large range in radius and position angle. All these lopsided galaxies were also noted to have large-scale velocity perturbations. For a quantitative measurement of lopsidedness the edge-on systems cannot be used. The cut-off in inclination used for the near-IR and HI studies is given in Sections 2.1.2 and 5.1 respectively.
 |
 |
 |
 |
Figure 1. Galaxies showing an asymmetry in the spatial extent of 2:1 or more in the HI distribution : M101 (top left, where the HI intensity is plotted here as gray scale) and NGC NGC 2841 (top right: here the HI contours are superimposed on an optical image), These galaxies were termed "lopsided" galaxies by Baldwin, Lynden-Bell, & Sancisi (1980). These figures are from Braun (1995) and Bosma (1981) respectively. Other typical examples are NGC 4654 (lower left: where HI contours are superimposed on an optical image) and UGC 7989 (lower right, showing contours and grey scale of the HI intensity), from Phookun & Mundy (1995), and Noordermeer et al. (2005) respectively. |
|
There was no further work on this topic for over a decade. Further HI mapping of a few individual galaxies such as NGC 4254 was done by Phookun, Vogel, & Mundy (1993) which stressed the obvious spatial asymmetry but they did not measure the lopsidedness. This paper studied the special case of the not-so-common one-armed galaxies such as NGC 4254 where the phase varies with radius (see Section 2.3).
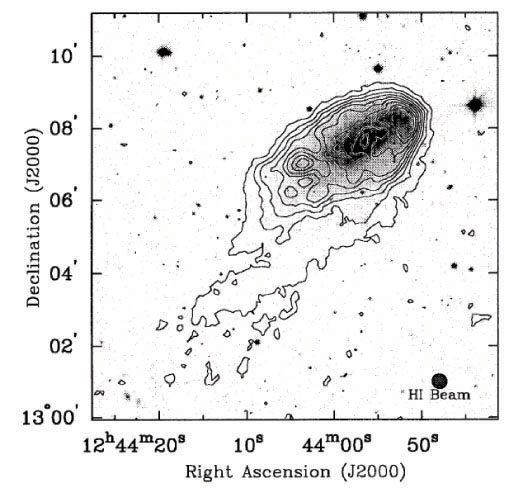
Richter & Sancisi (1994) collected data from single-dish HI surveys done using different radio telescopes, for a large sample of about 1700 galaxies. They found that 50% of galaxies studied show strong lopsidedness in their global HI velocity profiles. This could be either due to spatial lopsided distribution and/or lopsided kinematics. But since a large fraction of their sample shows this effect, they concluded that it must reflect an asymmetry in the gas density, as is confirmed by the correlation between the spatial and global HI velocity asymmetries in some galaxies like NGC 891, see Fig. 2 here. They argued that the asymmetry in HI represents a large-scale structural property of the galaxies. The criteria they used to decide the asymmetry are: (1). significant flux difference between the two horns (> 20% or > 8 sigma) (2). Total flux difference (> 55 : 45%) between the low and the high velocity halves (3). Width differences in the two horns (> 4 velocity channels or 50 km s-1). One word of caution is that it is not clear from their paper if these three give consistent identification of a galaxy as being lopsided or not.
 |
Figure 2. Asymmetric HI surface density plot of NGC 891 (contours at the bottom left); position-velocity diagram of the same galaxy (contours at the bottom right); and the global velocity profile in NGC 891 (spectrum at the top), from Richter & Sancisi (1994). |
The global velocity tracer is likely to underestimate the asymmetry fraction as for example if the galaxy were to be viewed along the major axis as pointed out by Bournaud et al. (2005b), or for a face-on galaxy as noted by Kamphuis (1993).
The comparison of asymmetry in the stars as detected in the near-IR and the HI asymmetry in surface density using the second criterion of Richter & Sancisi (1994) shows a similar behaviour in a sample of 76 galaxies (Fig. 6 of Bournaud et al. 2005b). However, the asymmetry is quantitatively larger and more frequent in HI than in stars. This result supports the conjecture by Richter & Sancisi (1994) that the asymmetry in the global velocity profiles is a good tracer of the disk mass asymmetry. While making this comparison, it should be noted, however, that the HI asymmetry is seen more in the outer radial range while the asymmetry in the near-IR is seen in the inner region of a galactic disk.
Haynes et al. (1998) studied the global HI profiles of 103 fairly isolated spirals. 52 of the 78 or ~ 75% galaxies showed statistically significant global profile asymmetry of 1.05. Many show large asymmetry: 35 have asymmetry > 1.1, 20 have > 1.15, and 11 have > 1.2.
The atomic hydrogen gas is an ideal tracer for a quantitative study of lopsidedness in galaxies since the HI gas extends farther out than the stars. The typical radial extent of HI is 2-3 times that of the stars (e.g. Giovanelli & Haynes 1988), and the amplitude of asymmetry increases with radius (Rix & Zaritsky 1995) as seen for the stars. However, surprisingly, a quantitative measurement of HI spatial lopsidedness has not been done until recently. In a first such study, the two-dimensional maps of the surface density of HI have been Fourier-analyzed recently to obtain the m = 1 Fourier amplitudes and phases for a sample of 18 galaxies in the Eridanus group (Angiras et al. 2006) - see Section 5.2 for details. Such analysis needs to be done for nearby, large-angular size galaxies using sensitive data which will allow a more detailed measurement of lopsidedness in nearby galaxies. A study along these lines is now underway using the data from WHISP, the Westerbork observations of neutral Hydrogen in Irregular and SPiral galaxies (Manthey et al. 2008).
The molecular hydrogen gas also shows a lopsided distribution in some galaxies, with more spatial extent along one half of a galaxy as in NGC 4565 (Richmond & Knapp 1986), IC 342 (Sage & Solomon 1991), NGC 628 (Adler & Liszt 1989) and M51 (Lord & Young 1990). However, this effect is not common in most cases and that can be understood as follows. The lopsidedness appears to be more strongly seen in the outer parts of a galaxy and the amplitude increases with radius as seen in stars (Rix & Zaritsky 1995), and also in HI gas (Angiras et al. 2006). Theoretically it has been shown that the disk lopsidedness if arising due to a response to a distorted halo with a constant amplitude can only occur in regions beyond ~ 2 disk scalelengths (Jog 2000). In most galaxies the molecular gas in constrained to lie within two disk scalelengths or half the optical radius (Young 1990). Hence we can see that in most galaxies, there is no molecular gas in the regions where disk lopsidedness in stars or HI is seen. This is why the molecular gas being in the inner parts of the galactic disk does not display lopsidedness in most cases.
2.1.2. Morphological lopsidedness in old stars
The near-IR traces the emission from the old stars since dust extinction does not significantly affect the emission in the near-IR. The systematic study of this topic was started in the 1990's when a few individual galaxies such as NGC 2997 and NGC 1637 were mapped in the near-IR by Block et al (1994). They noted the m = 1 asymmetry in these but did not study it quantitatively. The pioneering quantitative work in this field was done by Rix & Zaritsky (1995) who measured the asymmetry in the near-IR for a sample of 18 galaxies. In each galaxy, A1, the fractional amplitude for the m = 1 mode normalized by an azimuthal average (or m = 0), was given at the outermost point measured in the disk, i.e. at 2.5 exponential disk scalelengths. This distance is set by the noise due to the sky background in the near-IR. The mean value is 0.14 , and 30% have A1 values more than 0.20 which were defined by them to be lopsided galaxies. A typical example is shown in Fig. 3.
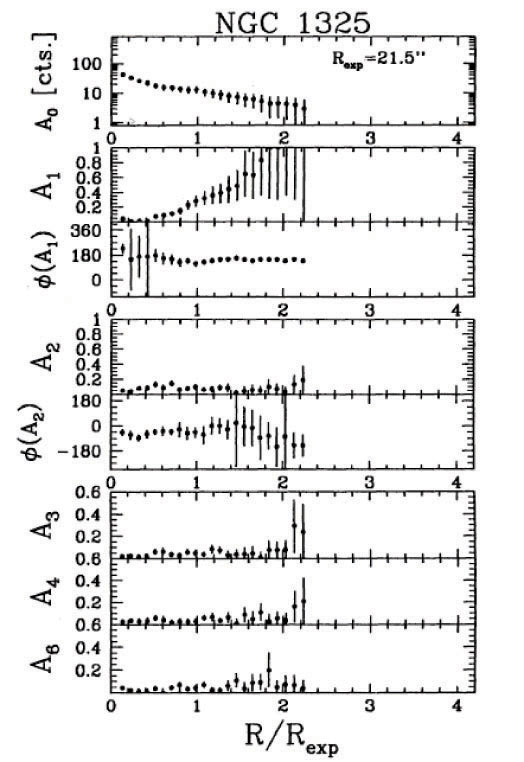 |
Figure 3. The values of the various fractional Fourier amplitudes and phases vs. radius in units of the disk scalelengths for NGC 1325 (from Rix & Zaritsky 1995). The amplitude scale in the lower three panels has been expanded by a factor of 5/3 for clarity, since these higher m components have smaller amplitudes. The lopsided amplitude A1 increases with radius, and the phase is nearly constant with radius. |
This study was extended for a sample of 60 galaxies by Zaritsky & Rix (1997). They carried out the Fourier analysis of the near-IR surface brightness between the radial range of 1.5-2.5 Rexp, where Rexp is the characteristic scale of the exponential light distribution. The normalised m = 1 Fourier amplitude A1 is a more representative indicator of disk lopsidedness.
It was shown that 30% of the galaxies have A1 > 0.2, which was taken to define the threshold lopsidedness as in the previous work. Rudnick & Rix (1998) studied 54 early-type galaxies (S0-Sab) in R- band and found that 20% show A1 values measured between the radial range of 1.5-2.5 Rexp to be > 0.19.
A similar measurement has recently been done on a much larger sample of 149 galaxies from the OSU (Ohio State University) database in the near-IR (Bournaud et al. 2005b), see Fig. 4. This confirms the earlier studies but for a larger sample, and gives a smaller value of lopsided amplitude, namely ~ 30% show lopsideness amplitude of 0.1 or larger when measured over the radial range of 1.5-2.5 Rexp. The galaxies with inclination angles of < 70° were used for this study. Since this is a large, unbiased sample it can be taken to give definitive values, and in particular the mean amplitude of 0.1 can be taken as the threshold value for deciding if a galaxy is lopsided. The lopsidedness also shows an increasing value with radius, as seen in the Rix & Zaritsky (1995) study.
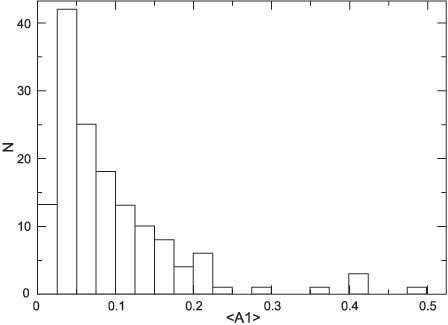 |
Figure 4. The histogram showing the distribution of lopsidedness measured in 149 galaxies at inclination of < 70° from the OSU sample (Bournaud et al. 2005b). The typical normalized lopsided amplitude A1 measured over the radial range between 1.5 to 2.5 disk scalelengths is ~ 0.1. Thus most spiral galaxies show significant lopsidedness. |
In the Fourier decomposition studies the determination of the center is a tricky issue, and the same center has to be used for all the subsequent annular radial bins, otherwise during the optimization procedure, a different center could get chosen and will give a null measurement for the lopsidedness. This is applicable for the lopsidedness analysis for HI (Angiras et al. 2006, 2007), and also for centers of mergers (Jog & Maybhate 2006). These two cases are discussed respectively in Sections 5.1 and 5.3.
The large number of galaxies used allows for a study of the variation with type. It is found that late-type galaxies are more prone to lopsidedness, in that a higher fraction of late-type galaxies are lopsided, and they show a higher value of the amplitude of lopsidedness (Bournaud et al. 2005b), see Fig. 5. This is similar to what was found earlier for the variation with galaxy type for the HI asymmetries (Matthews, van Driel, & Gallagher 1998). These samples largely consist of field galaxies, while the group galaxies show a reverse trend with galaxy type (Angiras et al. 2006, 2007) implying a different mechanism for the origin of lopsidedness in these two settings, see Section 5.1.
 |
Figure 5. The plot of the cumulative function of <A1> for three groups of Hubble types of spiral galaxies: the early-types (0 < T < 2.5), the intermediate types (2.5 < T < 5 ), and the late-types (5 < T < 7.5 ), where T denoted the Hubble type of a galaxy (taken from Bournaud et al. 2005b). The late-type galaxies are more lopsided than the early-type galaxies. |
While an axisymmetric galaxy disk gives rise only to radial gravity forces, and therefore no torque, any asymmetry in the disk, either m = 1, m = 2 or higher, gives rise to tangential forces in addition to radial forces, and then to a gravity torque. From the near-infrared images, representative of old stars, and thus of most of the mass, it is possible to compute the gravitational forces experienced in a galactic disk. The computation of the gravitational torque presents important complementary information, namely it gives the overall average strength of the perturbation potential as shown for m = 2 (Block et al. 2002), and for m = 1 (Bournaud et al. 2005b), whereas the Fourier amplitudes give values which are weighted more locally. The gravitational potential is derived from the near-infrared image, see Bournaud et al. (2005b) for the details of this method. The m = 1 component of the gravitational torque, Q1 between 1.5-2.5 disk scalelengths is obtained, the histogram showing its distribution is plotted in Fig. 6 , which is similar to that for the lopsided amplitude A1 (Fig. 4) as expected.
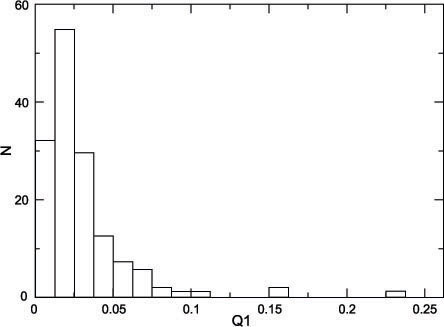 |
Figure 6. The histogram of Q1, the m = 1 Fourier amplitude in the gravitational potential, for the OSU sample of galaxies, from Bournaud et al. 2005b. |
An even larger sample based on the SDSS data has now been Fourier-analyzed by Reichard et al. (2008), and they also get a similar average value of lopsidedness in spiral galaxies, see Fig. 7. However, they use the surface density data between 50% and 90% light radii, so a clear one-to-one quantitative comparison of the values of lopsidedness from this work as compared to the previous papers in the literature discussed above is not possible. This work confirms that galaxies with low concentration, and low stellar mass density (or the late-type spirals) are more likely to show lopsidedness, as shown earlier for HI by Matthews et al. (1998) and for stars by Bournaud et al. (2005b).
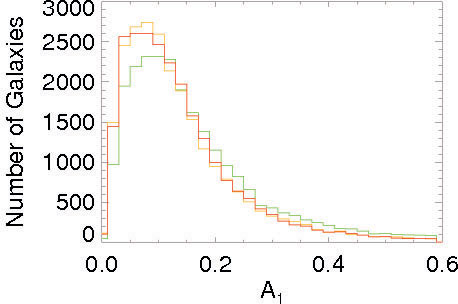 |
Figure 7. The histogram of number of galaxies vs. A1 values for the SDSS sample, from Reichard et al. (2008). The histogram gives similar values to the earlier studies by Rix & Zaritsky (1995) and Bournaud et al. (2005b) |
Another approach to measure the asymmetry involves the wedge method (Kornreich et al. 1998, 2002) where the flux within circular sectors or wedges arranged symmetrically with respect to the galactic disk centre are compared. While it is easier to measure this than the Fourier amplitudes, it gives only average values. An extreme limit of the wedge method is applied by Abraham et al. (1996) and Conselice et al. (2000). They define the rotation asymmetry parameter as the ratio of fractional difference between the two sides, so that 0 corresponds to a symmetric galaxy and 0.5 for the most asymmetric galaxy. This is a more global or average definition of the disk asymmetry and is suitable for studying highly disturbed galaxies, and not those showing a systematic variation as in a lopsided distribution. Such highly disturbed systems are seen at high redshifts, for which this criterion was used first.
An interesting point to note is that spurious signs of asymmetry arising due to dust extinction (Rudnick & Rix 1998) and that arising due to the pointing error of single-dish telescope (Richter & Sancisi 1994) were checked and ruled out. Conversely, a galaxy could look more symmetric in the global velocity profile than it is, if the galaxy is seen face-on. In that case even though the morphology is asymmetric - as in HI in NGC 628, the global velocity profile is symmetric, and hence the galaxy would appear to be kinematically symmetric - see Kamphuis (1993).
Based on the above discussion of the various methods, we recommend that the future users adopt the fractional Fourier amplitude A1 as the standard criterion for lopsidedness. This is because it gives a quantitative measurement, is well-defined, and can be measured easily as a function of radius in a galaxy, and thus allows an easy comparison of its value between galaxies and at different radii. The threshold value that could be adopted could be the average value of 0.1 seen in the field galaxies in the intermediate radial range of 1.5-2.5 Rexp (Bournaud et al. 2005b), so that galaxies showing a higher value can be taken to be lopsided. A uniform criterion will enable the comparison of amplitudes of lopsidedness in different galaxies, and also allow a comparison of the fraction of galaxies deduced to be lopsided in different studies.
The lopsidedness or a (cos
 ) asymmetry
is often also observed
in the kinematics of the galaxies. This could be as obvious as the
asymmetry in the rotation curves on the two halves of a galactic
disk, as is shown in Fig 8
(Swaters et al. 1999,
Sofue & Rubin 2001),
or more subtle as in the asymmetry in the velocity fields
(Schoenmakers et al. 1997).
Often the optical centres are distinctly separated
spatially from the kinematical centers as in M33, M31, and
especially in dwarf galaxies as pointed out by
Miller & Smith (1992).
The rotation curve asymmetry is also seen as traced in the optical for stars
(Sofue & Rubin 2001).
The detailed 2-D velocity fields were so far mainly observed for HI as
in the interferometric data (see e.g.
Schoenmakers et al. 1997,
Haynes et al. 1998).
Now such information is beginning to be
available for the bright stellar tracers as in
H
) asymmetry
is often also observed
in the kinematics of the galaxies. This could be as obvious as the
asymmetry in the rotation curves on the two halves of a galactic
disk, as is shown in Fig 8
(Swaters et al. 1999,
Sofue & Rubin 2001),
or more subtle as in the asymmetry in the velocity fields
(Schoenmakers et al. 1997).
Often the optical centres are distinctly separated
spatially from the kinematical centers as in M33, M31, and
especially in dwarf galaxies as pointed out by
Miller & Smith (1992).
The rotation curve asymmetry is also seen as traced in the optical for stars
(Sofue & Rubin 2001).
The detailed 2-D velocity fields were so far mainly observed for HI as
in the interferometric data (see e.g.
Schoenmakers et al. 1997,
Haynes et al. 1998).
Now such information is beginning to be
available for the bright stellar tracers as in
H emission
from HII regions
(Chemin et al. 2006,
Andersen et al. 2006),
however since the filling factor
of this hot, ionized gas is small, it is not an ideal tracer for a
quantitative study of disk lopsidedness.
emission
from HII regions
(Chemin et al. 2006,
Andersen et al. 2006),
however since the filling factor
of this hot, ionized gas is small, it is not an ideal tracer for a
quantitative study of disk lopsidedness.
Schoenmakers et al. (1997) use the kinematical observational data in HI on two galaxies - NGC 2403 and NGC 3198, and deduce the upper limit on the asymmetry in the m = 2 potential to be < a few percents. However, this method gives the result up to the sine of the viewing angle. Kinematic asymmetry in individual galaxies such as NGC 7479 has been studied and modeled as a merger with a small satellite galaxy (Laine & Heller 1999).
The rotation curve is asymmetric in the two halves of a galaxy or on the two sides of the major axis as shown for DDO 9 and NGC 4395 by Swaters et al. (1999), see Figure 8. However, they do not make a more detailed quantitative measurement of the asymmetry. Swaters (1999) in his study of dwarf galaxies showed that 50% of galaxies studied show lopsidedness in their kinematics. Schoenmakers (2000) applied his calculations on kinematical lopsidedness in galactic disks to five galaxies in the Sculptor group and found that all five show significant lopsidedness. A similar result has been found for the 18 galaxies studied in the Ursa Major cluster (Angiras et al. 2007). The frequency of asymmetry and its magnitude is higher in galaxies in groups - see section 5.2 for details.
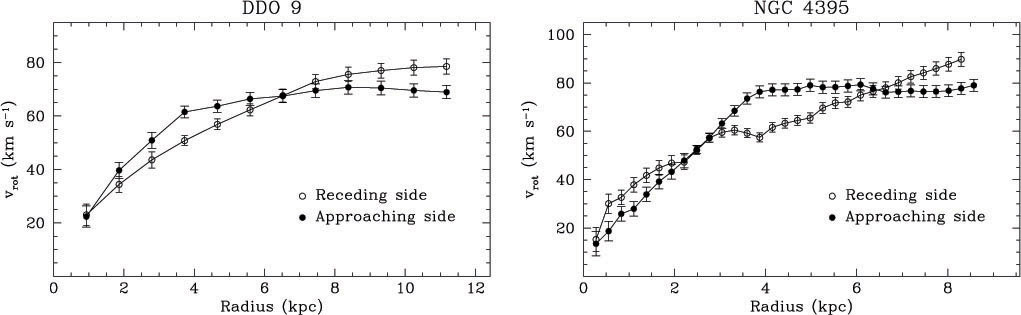 |
Figure 8. The rotation curve in DDO 9 and in NGC 4395 is asymmetric on two sides of the galaxy, from Swaters et al. (1999). |
A galaxy which shows spatial asymmetry would naturally show kinematical asymmetry (e.g., Jog 1997) except in the rare cases of face-on galaxies as discussed above where the galaxy can show asymmetry in the morphology but not in the kinematics. However, the papers which study lopsidedness do not always mention it. On the contrary, in the past, several papers have made a distinction between the spatial or morphological lopsidedness and kinematical lopsidedness (e.g. Swaters et al. 1999, Noordermeer, Sparke & Levine 2001) and have even claimed (Kornreich et al. 2002) that the velocity asymmetry is not always correlated with the spatial asymmetry. However, in contrast, it has been argued that the two have to be causally connected in most cases (Jog 2002), especially if the lopsidedness arises due to the disk response to a tidal encounter.
An important point to remember is that the same tracer (stars or HI) should be considered to see if a galaxy showing spatial lopsidedness is also kinematically lopsided or not, and vice versa. This is because the HI asymmetry is higher and is seen in the outer parts of the galaxy while the asymmetry in the near-IR is more concentrated in the inner regions. This criterion is not always followed (see e.g., Kornreich et al 2002). Thus the often-seen assertion in the literature that the spatial asymmetry is not correlated with kinematic asymmetry is not meaningful, when the authors compare the spatial asymmetry in the optical with the kinematical asymmetry in the HI.
2.3. Phase of the disk lopsidedness
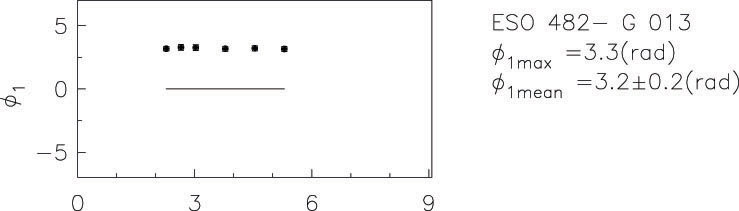
The phase of the lopsided distribution provides an important clue to its physical origin, but surprisingly this has not been noted or used much in the literature. Interestingly, the phase is nearly constant with radius in the data of Rix & Zaritsky (1995), as noted by Jog (1997). This is also confirmed in the study of a larger sample of 60 galaxies by Zaritsky & Rix (1997), (Zaritsky 2005, personal communication), and also for the sample of 54 early-type galaxies studied by Rudnick & Rix (1998). A nearly constant phase with radius was later confirmed for a larger sample of 149 mostly field galaxies (Bournaud et al. 2005b), and also for the 18 galaxies in the Eridanus group (Angiras et al. 2006). The latter case is illustrated in Fig. 9. This points to the lopsidedness as a global m = 1 mode, and this idea has been used as a starting point to develop a theoretical model (Saha et al. 2007). There are a few galaxies which do show a systematic radial variation in phase, as in M51 (Rix & Rieke 1993), which therefore appear as one-armed spirals.
 |
 |
Figure 9. The plot of the phase of the m = 1 Fourier component vs. radius (given in terms of the disk scalelength) for the HI surface density for two galaxies ESO 482- G 013 and NGC 1390 in the Eridanus group of galaxies, from Angiras et al. (2006). Note that the phase is nearly constant with radius indicating a global lopsided mode. |
In contrast, the central regions of mergers of galaxies, show highly fluctuating phase for the central lopsidedness (Jog & Maybhate 2006). This may indicate an unrelaxed state, which is not surprising given that the mergers represent very different systems than the individual spirals mainly discussed here.
2.4. Observations of off-centered nuclear disks
A certain number of galaxies are observed to have an off-centered nuclear disk, and more generally an m = 1 perturbation affecting more particularly the nuclear region. Our own Galaxy is a good example, since the molecular gas observations have revealed that the molecular nuclear disk has three quarters of its mass at positive longitude, which is obvious in the central position-velocity diagram (the parallelogram, from Bally et al 1988). The asymmetry appears to be mainly a gas phenomenon, since the off-centreing is not obvious in the near-infrared images (e.g. Alard 2001, Rodriguez-Fernandez & Combes 2008). The gas is not only off-centered but also located in an inclined and warped plane (Liszt 2006, Marshall et al 2008). An m = 1 perturbation is superposed on the m = 2 bar instability. The most nearby giant spiral galaxy, M31, has also revealed an m = 1 perturbed nuclear disk in its stellar distribution (Lauer et al 1993, Bacon et al 1994). The spatial amplitude of the perturbation is quite small, a few parsecs, and this suggests that this nuclear lopsidedness could be quite frequent in galaxies. However, it is difficult to perceive it due to a lack of resolution in more distant objects. Since M31 is the prototype of the m = 1 nuclear disk, we will describe it in detail in the next section. Some other examples have been detected, like NGC 4486B in the Virgo cluster (Lauer et al 1996), but the pertubation must then be much more extended, and that phenomenon is rare.
2.4.1. The case of the M31 nuclear disk
The first images of M31 to reveal the asymmetrical nucleus were the
photographs at 0.2" resolution from the Strastoscope II by
Light et al (1974).
They first resolved the nucleus, and measured a core radius of
0.48" (1.8pc). The total size of the nucleus is 4 arcsec (15pc).
They showed that the nucleus is elongated, with a low intensity extension
outside the bright peak (cf Fig. 10); and they
considered the possibility of a dust lane to mask the true center.
Nieto et al (1986)
confirmed this morphology
in the near-UV and also evoked dust. Later, it was clear that dust could
not be the explanation of this peculiar morphology, since the center was
still offset from the bulge in the near-infrared image
(Mould et al 1989).
As for the kinematics, it was already remarked by
Lallemand et al. (1960)
that the nucleus is rotating rapidly,
showing a very compact velocity curve, falling back to zero at a radius
of 2 arcsec. This was confirmed by
Kormendy (1988)
and
Dressler & Richstone
(1988),
who concluded to the existence of a black hole in the center of M31, of ~ 107
M , with the
assumption of spherical symmetry.
Lauer et al (1993,
1998)
revealed with HST that the asymmetrical
nucleus can be split into two components, like a double nucleus,
with a bright peak (P1) offset by ~ 0.5" from a secondary
fainter peak (P2), nearly coinciding with the bulge photometric centre,
and the proposed location of the black hole (e.g.
Kormendy & Bender 1999).
It is well established now from HST images from the far-UV to near-IR
(King et al. 1995,
Davidge et al. 1997)
that P1 has the same stellar population as the rest of the nucleus, and
that a nearly point-like source produces a UV excess close to P2
(King et al. 1995).
, with the
assumption of spherical symmetry.
Lauer et al (1993,
1998)
revealed with HST that the asymmetrical
nucleus can be split into two components, like a double nucleus,
with a bright peak (P1) offset by ~ 0.5" from a secondary
fainter peak (P2), nearly coinciding with the bulge photometric centre,
and the proposed location of the black hole (e.g.
Kormendy & Bender 1999).
It is well established now from HST images from the far-UV to near-IR
(King et al. 1995,
Davidge et al. 1997)
that P1 has the same stellar population as the rest of the nucleus, and
that a nearly point-like source produces a UV excess close to P2
(King et al. 1995).
 |
Figure 10. HST WFPC2 V-band image of M31. The surface brightness contributed by the UV cluster coinciding with the component P2 has been clipped out. The white dot indicates the position of the black hole. From Kormendy & Bender (1999). |
2-D spectroscopy by
Bacon et al (1994)
revealed that the stellar velocity field is roughly centred on P2,
but the peak in the velocity dispersion map is offset by
~ 0.7" on the anti-P1 side
(Fig. 11).
With HST spectroscopy the velocity dispersion peak reaches a value of
440 ± 70 km s-1 and the rotational velocity has a strong
gradient
(Statler et al. 1999).
The black hole mass required to explain these observations
ranges from 3 to 10 × 107
M.
The position of the black hole is assumed to coincide with the centre of
the UV peak, near P2, and possibly with the hard X-ray emission detected
by the Chandra satellite
(Garcia et al. 2000).
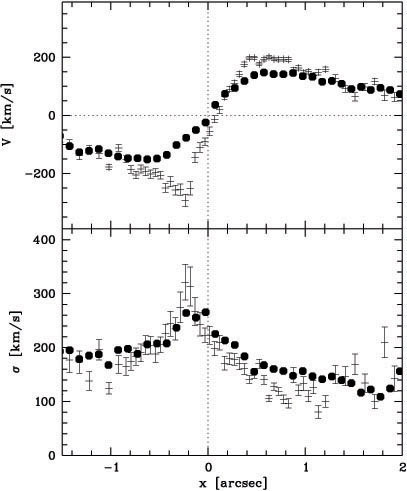 |
Figure 11. Velocity profile (top) and velocity dispersion (bottom) in the nucleus of M31. The crosses are from STIS (HST) and the filled circles from OASIS (CFHT). The OASIS kinematics have been averaged over a 0.2" wide slit (PA = 39°) - taken from Bacon et al. (2001). |
2.4.2. Other Off-centered nuclei
It has been known from a long time that the nearby late-type spiral M33 has a nucleus displaced from the young population mass centroid, by as much as 500pc (de Vaucouleurs & Freeman 1970, Colin & Athanassoula 1981). This off-centreing is also associated with a more large-scale lopsidedness, and can be explained kinematically by a displacement of the bulge with respect to the disk. Such kind of off-centreing is a basic and characteristic property of late-type Magellanic galaxies. In NGC 2110, an active elliptical galaxy, Wilson & Baldwin (1985) noticed a displacement of the nucleus with respect to the mass center of 220pc, both in the light and kinematics. Many other active nuclei in elliptical galaxies have been reported off-centered, but the presence of dust obscuration makes its reality difficult to assert (e.g. Gonzalez-Serrano & Carballo 2000, where 9 galaxies out of a sample of 72 ellipticals are off-centered).
Quite clear is the case of the double nucleus in the barred spiral M83 (Thatte et al 2000): near-infrared imaging and spectroscopy reveals, in spite of the high extinction, that the nucleus is displaced by 65pc from the barycenter of the galaxy, or that there are two independent nuclei. Molecular gas with high velocity is associated with the visible off-center nucleus, and this could be the remnant of a small galaxy accreted by M83 (Sakamoto et al 2004). In some cases what appeared to be a double nucleus could in fact be two regions of star formation in centers of mergers of galaxies as in Arp 220 (Downes & Solomon 1998).
Recently, Lauer et al (2005) studied a sample of 77 early-type galaxies with HST/WFPC2 resolution, and concluded that all galaxies with inner power-law profiles have nuclear disks, which is not the case of galaxies with cores. They found 2 galaxies with central minima, likely to have a double nucleus (cf Lauer et al 2002), and 5 galaxies having an off-centered nucleus. This perturbation also appears as a strong feature in the Fourier analysis (A1 term).
Off-centering is also frequently observed in central kinematics, where the peak of the velocity dispersion is displaced with respect to the light center (Emsellem et al 2004, Batcheldor et al 2005). Decoupled nuclear disks, and off-centered kinematics are now clearly revealed by 2D spectroscopy.