


2.1. Spectropolarimetry of Radio Galaxies and the Discovery of Hidden Quasars
Hidden Quasars inside radio galaxies are discussed in Antonucci 1993, Wills 1999, and Tadhunter 2008. I'll describe many relevant observations here, moving from the radio and then on up in frequency to the X-ray. First though I will introduce some background optical information, and will return to that waveband in Section 2.5.
It was noticed in the early 1980s that for some Narrow Line Radio
Galaxies and Seyfert 2 galaxies, a small measured optical polarization
could often be intrinsically large
( 10%) after
starlight subtraction, and that the electric vector position angle was
generally perpendicular to the radio structure axis
(Antonucci 1982,
1983,
2002;
Miller and Antonucci
1983;
McLean et al 1983;
Draper et al 1993
etc). Furthermore, the polarized light spectrum (similar to the scattered
light spectrum in spectral features) revealed the features of Type 1
AGN, with the first case being the powerful hidden Quasar in the radio
galaxy 3CR234 shown in
Fig. 2
(Antonucci 1982,
1984;
Tran et al 1995;
Young et al 1998).
As noted earlier, this means that the galaxies contain hidden Quasars,
and that their photons can reach us by exiting the nuclei along the
(radio) structural axes and then scattering into the line of sight. The
Tran et al 1995
polarized flux spectrum is shown in
Fig. 2.
10%) after
starlight subtraction, and that the electric vector position angle was
generally perpendicular to the radio structure axis
(Antonucci 1982,
1983,
2002;
Miller and Antonucci
1983;
McLean et al 1983;
Draper et al 1993
etc). Furthermore, the polarized light spectrum (similar to the scattered
light spectrum in spectral features) revealed the features of Type 1
AGN, with the first case being the powerful hidden Quasar in the radio
galaxy 3CR234 shown in
Fig. 2
(Antonucci 1982,
1984;
Tran et al 1995;
Young et al 1998).
As noted earlier, this means that the galaxies contain hidden Quasars,
and that their photons can reach us by exiting the nuclei along the
(radio) structural axes and then scattering into the line of sight. The
Tran et al 1995
polarized flux spectrum is shown in
Fig. 2.
Since then many other radio galaxies, in general those with strong high-ionization lines like 3CR234, have shown hidden Quasars in polarized light. These papers include most of them: Tran et al 1995, 1998; Cohen et al 1999; Young et al 1996; Dey et al 1996; Cimatti et al. 1996, 1997; Ogle et al 1997 on Cygnus A (see also Antonucci et al 1994); Cohen et al 1999; Hurt et al 1999; Kishimoto et al 2001; Vernet et al 2001; Tadhunter et al 2002; Solorzano-Inarea et al 2004; Tadhunter 2005.
Many Seyfert 2s were subsequently shown to have hidden Type 1 nuclei by this method (Antonucci and Miller 1985; many references are given in Tran 2003), but radio loud cases were fewer, at least partially because they are more distant and fainter.
While there is no question that 3CR234 hosts a powerful hidden Quasar, it has some properties which make it somewhat special as a radio galaxy: the luminous high-ionization narrow lines, and the powerful infrared dust source (see Fig. 3; also Young et al 1998). Most of the other radio galaxies shown to host hidden Quasars in this way share these properties (Cohen et al 1999). Both properties are rare in FR I radio galaxies, and at low and moderate redshift, many FR IIs differ from this pattern as well (e.g., Hine and Longair 1979; Table 2 of Cohen and Osterbrock 1981 on optical spectra; Ogle et al 2006, Dicken et al 2009 on infrared observations). Many of these have low-ionization, low luminosity emission lines (Miley and Osterbrock 1979). (All of my reference lists are undoubtedly incomplete!)
Radio galaxies with z
1 usually have
resolved optical light, and much of
the light is scattered from hidden Quasars
(Chambers et al 1987;
McCarthy et al 1987;
Dunlop and Peacock 1993;
Cimatti et al 1993).
Spectacular exceptions include 4C41.17
(Dey et al 1997)
and 6C 1908+722
(Dey 1999);
they show optical light extended along the radio axes, but it is mostly
unpolarized starlight.
However, these z ~ 4 objects are observed at higher rest-frame
frequencies than explored in other objects.
2.2. Puzzling statistics on the radio properties of FR II radio galaxies and Quasars
There are a few historical papers which are interesting and illustrative of the reasoning that led to much progress on unification. Peter Barthel worked mostly on VLBI observations of superluminal sources in the 1980s, noting that the beam model explained many properties such as superluminal motions and jet sidedness qualitatively, but he was (according to the title of a rumination for a conference) "feeling uncomfortable" because one had to assume that a large fraction of these sources in various samples have jet axes fortuitously close to the line of sight. 17 Barthel later wrote a famous paper (Barthel 1989) entitled "Are all Quasars beamed?" suggesting that those Quasars whose axes lie near the sky plane somehow fall out of Quasar samples, and (inspired by the spectropolarimetry) might be classified as radio galaxies. Note though that he did not entitle his paper "Do all radio galaxies contain hidden Quasars?" The answer to that question would be no, but the answer to the question he posed is still basically yes.
The general idea of beaming to explain superluminal motions and one-sided jets was accepted by most doubters as a result of two key discovery papers reporting on the so-called lobe depolarization asymmetry. There is a very strong tendency for one radio lobe in double-lobed radio Quasars to be depolarized at low frequencies by Faraday rotation within the observing beam on the side of the single-jet sources which lacks the jet (Laing 1988; Garrington et al 1988). Most people accepted that the depolarized lobe must be the more distant one, located behind a large-scale depolarizing magnetoionic medium; thus the polarized lobe is on the near side, so that the jet is also on the near side, as expected for beaming. (A demur can be found in Pedelty et al 1989.)
The selection criteria in Laing 1988 and in Garrington et al 1988 favored low-inclination sources; nevertheless it is amusing that the former paper has this disclaimer: "The sources observed here must then be oriented within about 45 degrees of the line of sight...to generate sufficient asymmetry in path length..." to fit the depolarization data. Their referees must not have been particularly curious people not to ask for elaboration. We now know that many of the high-inclination sources were masquerading as FR II radio galaxies.
Barthel (1989) focused on the 3CR sources in the redshift interval 0.5 < z < 1.0, in order to avoid low-luminosity, especially FR I radio galaxies, which he did not propose to identify with Quasars, noting that "radio loud Quasars invariably 18 have (lobe) luminosities in excess of the Fanaroff and Riley division." He also pointed out that the 3CR radio galaxies above z = 0.5 have strong emission lines like Quasars. 19 He notes further that, based on early fragmentary data, only a subset of FR II radio galaxies are strong IR dust emitters. Finally, Barthel crucially adds this claim later in the paper: "...including the 0.3 < z < 0.5 and/or the 1.0 < z < 1.5 redshift range does not alter [his conclusions] markedly."
I was particularly moved a few years later by a paper by Singal (1993), entitled "Evidence against the Unified Scheme for Powerful Radio Galaxies and Quasars." I reproduce two of his figures here (the present Fig. 5 and 6). His histograms of number densities and cumulative linear size distributions are similar to Barthel's for z > 0.5, but he includes low-redshift FR II sources in a new z < 0.5 bin, where "all hell breaks loose." The median projected linear size in Quasars relative to radio galaxies no longer shows a satisfying reduction expected for foreshortening, and the number density of FR II radio galaxies becomes much higher than those of Quasars.
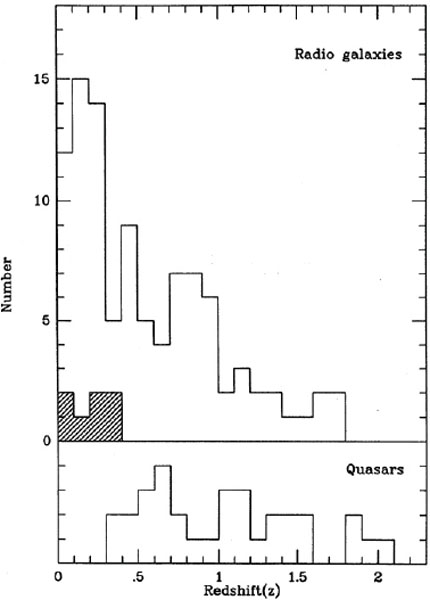 |
Figure 5. Redshift distribution of 131 radio galaxies and Quasars in the 3CR sample, taken from Singal 1993. Crucially, the hashed "Broad Line Radio Galaxies" must be mentally moved to the lower plot for the purposes of this paper. Note the large ratio of the number of radio galaxies to that of Quasars at low redshift. |
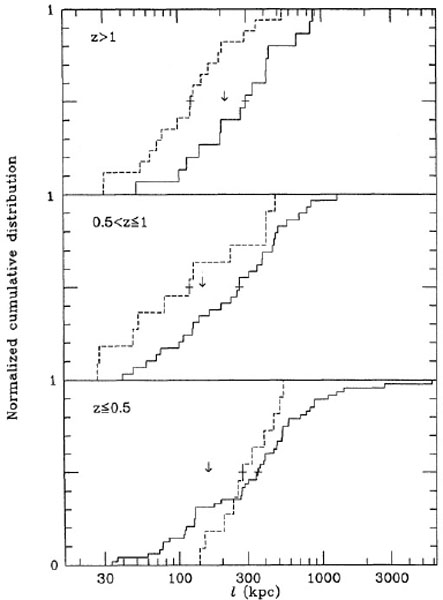 |
Figure 6. Cumulative distributions of projected linear sizes of radio galaxies (continuous curve) and Quasars (dashed curve) in several redshift bins. Crosses mark the median values, and arrows are for a test used by the author, but not referred to here (Singal 1993). The foreshortening expected in the shadowing Unified Model is not seen at low redshift. |
Singal suggested that this spoiled the Unified Scheme, but a clever alternative was suggested by Gopal-Krishna et al (1996). They showed that subject to two assumptions justified or at least motivated by independent observations, Singal's histograms could all be easily understood in the beam model. One hypothesis was that the torus opening is set by the initial radio power of a source; the other was that the luminosity of a growing giant double radio source decreases over time in a certain way. Without going through all the reasoning, it turns out in this case that in the lowest redshift bin, one is preferentially comparing older Quasars to younger radio galaxies, canceling (to the modest accuracy attainable) the expected size difference between the two types of radio source.
There is another possible explanation for Singal's histograms: there is a population of FR II radio galaxies, concentrated at low redshift, which simply lacks hidden Quasars. 20
2.3. The infrared calorimeter for visible and hidden FR II radio sources
Distinguishing these two hypotheses motivated my group and others to pursue observations of radio galaxies in the thermal infrared, where the infrared calorimeter (radiation reprocessed as infrared) must show us the putative hidden Quasars, independently of orientation. Remember that the spectropolarimetric test for hidden AGN requires a somewhat fortuitous geometry, where a gas and dust cloud must have sufficient optical depth and covering factor to reflect detectable light, and it must have a view of both the hidden Quasar and the observer on Earth. Thus it is an incomplete method for finding hidden AGN.
David Whysong and I started imaging 3CR radio galaxies and Quasars from Singal's list at Keck Observatory in the 1990s, but equipment problems, terrible weather, and dim and unprofessional referees delayed our project until ISO and even Spitzer were making big radio galaxy surveys, albeit at low angular resolution. The power and elegance of the infrared calorimeter is shown best however in the composite of high-resolution (~ 0.3") images reproduced from Whysong's (2005) thesis, and shown here as Fig. 7.
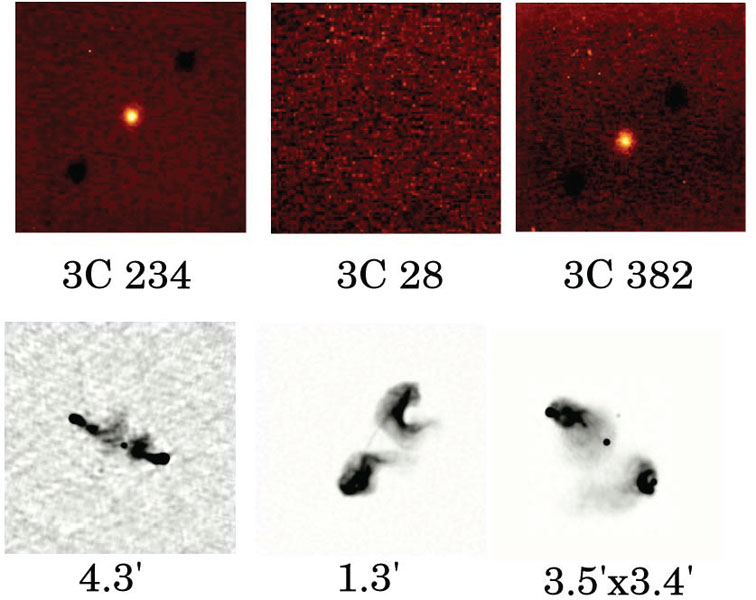 |
Figure 7. Keck images of three radio-loud FR II AGN, taken in the thermal IR at 11.7µ. 3CR382 is a visible Broad Line Radio Galaxy. 3CR234 is known to be a hidden Quasar from its optical polarized flux spectrum. Apparently, 3CR28 does not hide a powerful Quasar since no infrared reradiation is detected. (Note that the apparent correlation of radio core strength with central engine type is not a general property.) From Whysong 2005. |
2.4. Infrared properties of FR II Quasars and radio galaxies from the 3CR catalog
Many groups have been seduced by the seeming simplicity and robustness of the infrared calorimeter. A rather complete review of early (pre-Spitzer) observations is given in the Introduction to Cleary et al 2007, reporting on Spitzer observations of 3CR objects with 0.5 < z < 1.4. Other recent papers include Meisenheimer et al 2001; Siebenmorgen et al 2004; and Whysong and Antonucci 2004, including some 0.3"-resolution Keck data at 11.7µ.
Meisenheimer et al (2001) observed 20 3CR objects with ISO, finding the results compatible with hidden Quasars, except possibly for some at the low luminosity/redshift end. Relatedly, Siebenmorgen et al (2004) found 68 detected 3CR objects in the ISO archive, finding that, "In most 3CR objects, the mid- and far-IR flux cannot arise from stars nor from the radio core because an extrapolation of either component to the infrared fails by orders of magnitude."
Shi et al (2005) used Spitzer photometry to study a sample of 3CR radio galaxies and steep-spectrum Quasars with good Hubble Space Telescope (HST) images, and with "a preference for z < 0.4". The data are consistent with the assertion that most radio galaxies have hidden Quasars. Furthermore, there is evidence for nonzero optical depths at 24µ. Importantly, the entire infrared dust spectrum is generally inferred to be AGN powered, even at 70µ.
Spectroscopy in the optical and the infrared can deliver more specific information. Sometimes the optical narrow line spectrum indicates a lower ionization or luminosity than is actually present, and thus one could conclude that a hidden Quasar is not present. Again infrared photometry and spectroscopy are more complete. Haas et al (2005) wrote a key paper which must be kept in mind whenever narrow line spectra are discussed. I hope more work is done along these lines. Haas et al (2005) found that in a set of seven radio galaxies and seven Quasars from the 3CR catalog, the radio galaxies observed in the optical have on average less luminous high ionization lines than the Quasars, but that in the relatively transparent mid-IR region, for this small sample of FR IIs at least, this is not the case. Haas et al find that "the luminosity ratio [OIII]5007Å / [OIV]25.9µ of most galaxies is lower by a factor of 10 than that of the Quasars"! 21
Similarly, di Serego Alighieri et al (1997) showed that for some powerful radio galaxies at least, [O III]5007Å shows up to some degree in polarized flux, indicating some [O III]5007Å is probably hidden by the torus in some cases; but note that it's not always easy to interpret the small polarizations of [O III]5007.
Another important consideration is that at least part of the obscuration of the Narrow Line Region in radio galaxies is due to the modest-optical-depth kpc-scale dust lanes as seen so dramatically in Cyg A and Cen A. See discussion in Antonucci and Barvainis 1990. Ignoring this information in testing and exploiting the Unified Model will produce erroneous results. Absorption by cold foreground dust is manifest as very deep mid-IR absorption features.
Now let's go back to the figures from Singal et al 1993, here Fig. 5 and 6. We noted that at low redshift, a large fraction of 3CR FR II radio galaxies are smaller than expected for high inclination Quasars. This could be interpreted as evidence that there are many intrinsically small radio galaxies which lack powerful hidden Quasars. By powerful, I mean hidden Quasars roughly matched in reradiated Big Blue Bump luminosity with radio galaxies of the same lobe flux and redshift. (Some allowance needs to be made for mid-IR anisotropy.) Alternatively, recall that Gopal-Krishna et al (1996) cleverly noted that two externally motivated assumptions would cause a universally applicable unified model (hidden Quasars in all radio galaxies) to lead to data matching the observations; one has to assume that radio sources tend to fade over time, and that the opening angle of the torus increases with the original radio power. Our group was fortunate to receive time for Spitzer IRS surveys of several types of radio-loud AGN, including 3CR FR II radio galaxies and Quasars (Ogle et al 2006, 2007). The 2006 paper was the first from a big Spitzer IRS-spectrograph survey.
These infrared data show in fact that many of the 3CR FR II radio galaxies,
especially those at z
 0.5 (below the
redshift considered in
Barthel 1989),
have only weak and cool dust emission. Again if many of these objects have
AGN hidden by dust, then the average dust covering factor would need to
be reasonably large, so that the dust calorimeter should work at least
statistically. Most 3CR FR II radio galaxies with 0.5 < z <
1.0 do have strong, Quasar-like mid-IR emission. This is qualitatively
in accord with both Barthel's and Singal's figures (which suggests a
dearth of hidden AGN in FR IIs only at z < 0.5). Also we now
know from Spitzer that essentially all the z
1 radio galaxies in
the 3CR can be unified with Quasars by orientation
(Ogle et al 2006;
Haas et al 2008;
Leipski et al 2010;
de Breuck et al 2010,
which covers (non-3CR) galaxies up to z = 5.2). Compare
Fig. 8, showing mid infrared luminosity vs. z,
with Figs. 5
and 6 (from
Singal 1993).
22
0.5 (below the
redshift considered in
Barthel 1989),
have only weak and cool dust emission. Again if many of these objects have
AGN hidden by dust, then the average dust covering factor would need to
be reasonably large, so that the dust calorimeter should work at least
statistically. Most 3CR FR II radio galaxies with 0.5 < z <
1.0 do have strong, Quasar-like mid-IR emission. This is qualitatively
in accord with both Barthel's and Singal's figures (which suggests a
dearth of hidden AGN in FR IIs only at z < 0.5). Also we now
know from Spitzer that essentially all the z
1 radio galaxies in
the 3CR can be unified with Quasars by orientation
(Ogle et al 2006;
Haas et al 2008;
Leipski et al 2010;
de Breuck et al 2010,
which covers (non-3CR) galaxies up to z = 5.2). Compare
Fig. 8, showing mid infrared luminosity vs. z,
with Figs. 5
and 6 (from
Singal 1993).
22
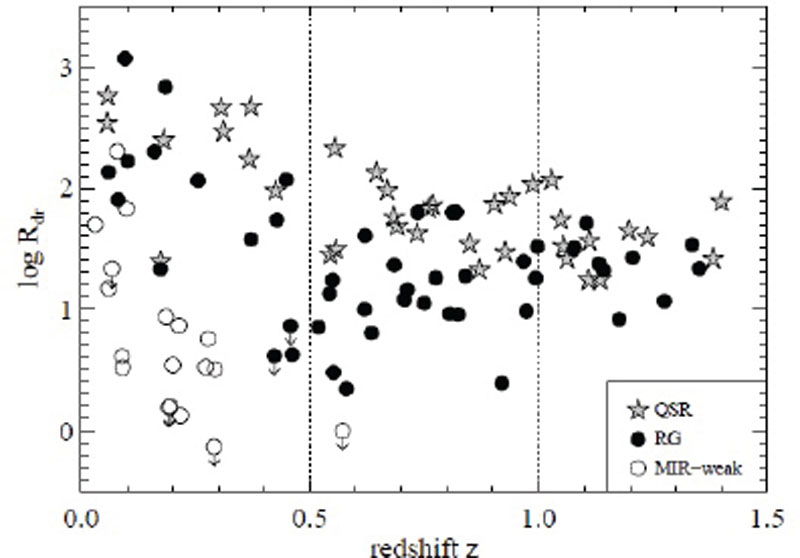 |
Figure 8. Radio-normalized mid infrared luminosity plotted vs. the redshift z. 15 µm and 178 MHz refer to rest wavelength and frequency (Leipski et al 2010). Stars represent Quasars and filled circles refer to the putative hidden Quasars, with L(MIR) ~ L(MIR) for visible Quasars. Empty circles lack visible or hidden Quasars, and their presence at low z can explain Fig. 5, 6 and Barthel's (1989) histograms [see text]. |
Now let's see how the accretion luminosities, taking account of the IR
data, compare with LEdd
(Fig. 9). Among
these radio galaxy black holes, the ones considered to be hidden Quasars
(for which probably MBH ~ 109
M )
radiate at ~ 0.1% of Eddington in dust
reradiation only, and the others are below that value.
(Figure 9 is
a preliminary version of this plot, with some subjective elements,
kindly supplied by
P. Ogle 2010.)
Although this cut isn't always
accepted by nature, it's interestingly close to the value expected for
the shift from ADAF to thermal optically thick Big Blue Bump
(mcrit =
1.3
)
radiate at ~ 0.1% of Eddington in dust
reradiation only, and the others are below that value.
(Figure 9 is
a preliminary version of this plot, with some subjective elements,
kindly supplied by
P. Ogle 2010.)
Although this cut isn't always
accepted by nature, it's interestingly close to the value expected for
the shift from ADAF to thermal optically thick Big Blue Bump
(mcrit =
1.3 2 which
produces L ~ 0.13% of
LEdd, for 10% efficiency in
= 0.1 models:
Esin et al 1997).
2 which
produces L ~ 0.13% of
LEdd, for 10% efficiency in
= 0.1 models:
Esin et al 1997).
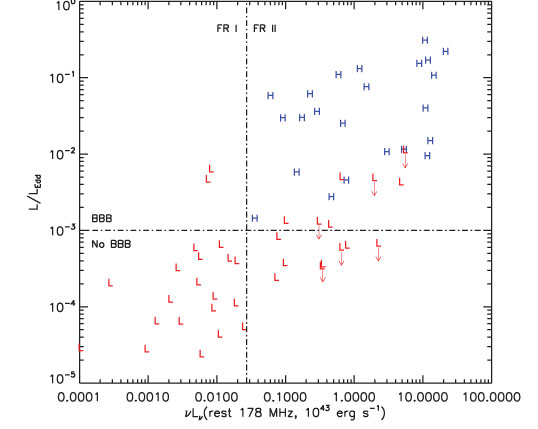 |
Figure 9. This plot of 3CRR radio sources is preliminary and involves some judgment regarding covering factor, absorption inside the torus, infrared anisotropy, and bolometric corrections. Masses are based on Spiral bulge or Elliptical host luminosity. Uncertainties are a factor of several. Note that the objects with Quasar-like mid-infrared luminosities are almost all of type FR II, as well as high in ionization level. Details in Ogle et al 2010b. |
If one were to display the apparent optical luminosities in Eddington terms, there would be no change in narrow line ionization (see H and L symbols) at this expected location in L / LEdd of the accretion mode change. But using the infrared luminosities 23 seems to confirm theory spectacularly, if approximately. It is also very clear that both the ionization level and (more surprisingly) the FR type are tightly correlated with accretion mode, as deduced by many authors over the years, and cited in context in this paper.
When a galaxy lacks an observable Big Blue Bump, even when using the IR
reradiation to find it, we can of course only put an upper limit on the
flux of that component. According to theory, objects with
L / LEdd
0.01 aren't
expected to produce optically thick
accretion disks (Big Blue Bumps), so perhaps few weak ones are missed
(Begelman, Blandford and
Rees 1984).
However, the theory isn't yet
robust enough to be used in this way with certainty.
There are several fiducial luminosity comparisons that we can make to our infrared upper limits in the radio galaxies: we can compare them to those of matched broad line objects to constrain the universality of the unified model. More important physically, we can compare it to the jet power. The latter is hard to get, and other than for the nearby and powerful object M87, the infrared limits are too high to be of interest in comparing to jet power. But for M87, any hidden Quasar must produce much less radiative than kinetic luminosity (Whysong and Antonucci 2004; Owen et al 2000; Perlman et al 2001).
I end this section with some general caveats on unified models and accretion modes for FR II radio sources. 1) We're discussing the highest-luminosity radio sources at each redshift, and in the case of the complete geometrical unification at z > 1, we're only talking about some of the most luminous radio sources in the universe. 2) The statistical significance of the Singal figures makes them robust, but it isn't sufficient for any further investigation by subdivision. 3) At least at the highest redshifts, we know that there is a major contribution to the projected linear sizes of radio sources besides foreshortening. It was shown by Best et al 2000 and subsequent papers that the z ~ 1 3CR radio galaxies' projected linear sizes in the extended gas correlates strongly with ionization level, the smaller ones tending to have shock spectra. Aside from adding noise to the radio size tests, this doesn't affect the discussion too much, though of course it's important from a physical point of view. Note also that that correlation is shown in Best et al 2000 for the radio galaxies alone, where orientation is relatively unimportant, so the claim would have to be softened if made for the entire high-z 3CR sample.
2.5. Nonthermal optical "compact cores"
Several authors have commented on the optical point sources seen even in some Narrow Line Radio Galaxies which lack a visible Type 1 spectrum. This is different behavior than that in Seyfert 2s, few of which have point sources or variability - their mirrors are extended and spatially resolved by the Hubble Space Telescope in nearby cases, e.g., Capetti et al 1995a, b; Kishimoto 1999, 2002a, b.
It's artificial to separate the FR Is from the FR IIs in this context,
because the entire radio galaxy population empirically separates itself
in a different way: the large majority of 3CR FR Is (these are nearby,
z 0.2),
and many low (z < 0.5) and some intermediate
(0.5 < z < 1.0) redshift 3CR sources have optical nuclei which
are consistent with emission from the unresolved bases of the radio
jets. References are given below.
In general there are no spectra available of these optical point sources, and certainly no spectropolarimetry. However, the red-region HST point source luminosities and fluxes correlate fairly well with the 5 GHz (usually flat spectrum) radio cores, which are indeed the bases of jets as shown by VLBI maps. It's important that the correlation shows up in a flux-flux plot as well as in a luminosity-luminosity plot. 24
Chiaberge and collaborators have worked carefully and doggedly on these sources, and FR IIs are described primarily in Chiaberge et al 2000, 2002a, b. The entire data set and analysis is consistent with (but preceded!) the inferences from the infrared. Chiaberge et al argue that the radio galaxies that fall on the well-populated (putative) synchrotron line in the optical/core-radio plane are likely to be nonthermal AGN. The group of radio galaxies with larger optical flux than expected for synchrotron radiation then host a visible Big Blue Bump/Broad Line Region.
These authors further suppose that any opaque tori would be larger than the optical point sources, in which case they would block the optical light; therefore there are no tori in most such cases. Although M87 is an FR I (or hybrid) source, it's worth mentioning in this section that its HST point source is indeed small, because it varies on timescales of months. 25
Detailed study of 100 low luminosity 3CR radio galaxies with HST at 1.6µ is quite consistent with the prior conclusions of the Chiaberge et al group. In particular the low ionization galaxies of both FR types show "central compact cores" which are probably nonthermal in nature (Baldi et al 2010).
Powerful supporting evidence by the same group comes in the form of a spectroscopic survey of z < 0.3 galaxies (Buttiglione et al 2010). As had been noted by e.g., Hine and Longair (1979), FR II radio galaxies can be naturally divided into low and high ionization objects. But Buttiglione et al (2010) go a big step further and assert that their emission-line "excitation index" is bimodal (their Fig. 4)! The first and only other claim of a related bimodality of which I am aware is that of Marchesini et al (2004), who cite such a feature in the distribution of L / LEdd at a value of ~ 0.01. It's worth keeping that value in mind.
Just as for the infrared data, the demographic conclusion from these optical studies is that the fraction of 3CR FR II radio galaxies with visible or hidden Quasars is relatively small at low redshift, increasing up to at least z ~ 0.6 (see also Varano et al 2004, and for a slightly different opinion, Dicken et al 2010).
Finally, it's been found that as a group, "radio loud" galaxies and
Quasars (in this case with a flux cutoff or 3.5 mJy at 1.5 GHz - which is
extremely low compared with the 3CRs) are clustered differently, with
the Quasars favoring richer environments
(Donoso et al 2010).
This result is consistent with the views expressed here because objects with
L (1.5 GHz)
1033
erg/sec/Hz (essentially the range of 3CR
radio galaxies and Quasars) do cluster more like Quasars, according to
that paper. Nevertheless it strongly suggests that the shadowing
unification doesn't apply at lower radio luminosities.
26
(1.5 GHz)
1033
erg/sec/Hz (essentially the range of 3CR
radio galaxies and Quasars) do cluster more like Quasars, according to
that paper. Nevertheless it strongly suggests that the shadowing
unification doesn't apply at lower radio luminosities.
26
Hidden radio Quasars are characterized by large (~ 1022 - 1025 cm-2 or more) cold absorbing columns, like the Seyfert 2s and radio-quiet Quasar 2s. The Low Ionization Galaxies generally don't show large columns 27 and this suggests that they lack tori and Broad Line Regions, although it's always possible that the jet continuum emission extends beyond a torus (Hardcastle et al 2009). See their Fig. 16 and their table 7 for the columns for Low Ionization Galaxies and other classes of AGN. These authors argue persuasively that one can separate X-ray components from hidden Quasars and from jet emission, modeling the X-ray spectra with high-column and zero-column components, respectively (see Figure 10).
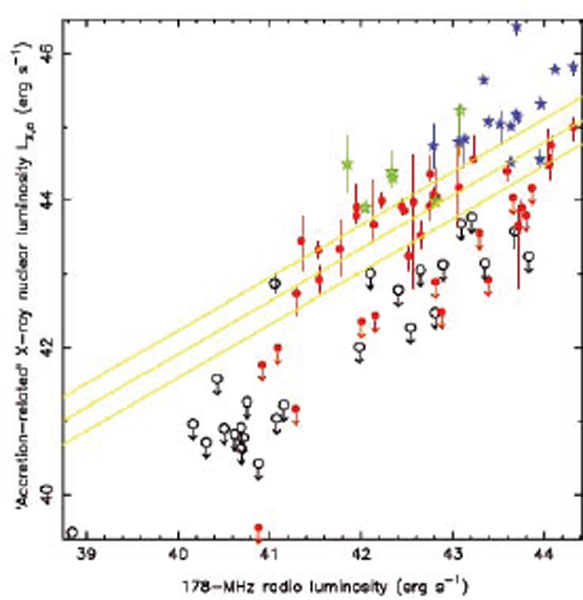 |
Figure 10. X-ray luminosity for the `accretion-related' (absorbed) component as a function of 178-MHz total radio luminosity for the z < 1.0 3CRR sample. Regression is for detected Narrow Line Radio Galaxies only. Black open circles indicate Low-Ionization Narrow Line Radio Galaxies, red filled circles High-Ionization Narrow Line Radio Galaxies, green open stars Broad Line Radio Galaxies and blue filled stars Quasars. Clearly the Low Ionization objects have little or no thermal emission. (Adapted from Hardcastle et al 2009). |
Thus with reasonable SNR in the X-ray spectrum, one can say which
spectral component likely dominates that ostensibly derived from jet
synchrotron emission and those directly related to a copious accretion
flow - and often one dominates completely. Examples of each type are
shown in the FR II galaxies in
Rinn et al 2005;
Kraft et al 2007;
Trussoni et al 2007;
and
Evans et al 2010.
The X-ray spectroscopic survey of high-z 3CR objects of
Wilkes et al 2009,
like the infrared study of
Leipski et al 2010,
is extremely supportive of
complete unification of 3CR radio galaxies and Quasars at z
1.
The putative accretion-disk
K- lines in the thermal
radio galaxies and Quasars seem to be weaker and narrower than in
Seyferts, a fact often attributed to an inner edge of an optically thick
flat accretion disk at a greater radius than that at which the disks in
radio quiets terminate (e.g.
Ogle et al 2005;
Sambruna et al 2009;
Tazaki et al 2010).
The accretion disks are often taken to have inner edges at
the Innermost Stable Circular Orbit
28, but this is
controversial (e.g.
Agol and Krolik 2000).
If the innermost part of the opaque
thin disk is missing, the efficiency of the standard
29
disk is reduced, and also the thermal spectrum is cooler, so one would
expect (but doesn't see) corresponding changes in the spectral line
ratios and luminosities
(Ogle et al 2005).
Also in a recent study by
Molina et al (2008)
on a sample selected at 20-40 keV, for their six "definite" Broad Line Radio
Galaxies, "we only find marginal evidence for weaker reprocessing
features in our objects compared to their radio quiet counterparts."
More commentary on this can be found in
Kaburaki et al 2010.
17 When selecting by high-frequency radio flux, one preferentially selects objects whose jet axes point in our general direction because of beaming, but this effect can't explain the apparent preference for this orientation quantitatively. Back.
18 "Almost invariably" would have been more accurate, e.g., Quasar 1028+313 in Gower and Hutchings 1984 Back.
19 Today we would say that the large majority of them have strong emission lines. Back.
20 As we will see, some FR II radio sources do lack Quasars, even hidden Quasars, and they should form a roughly isotropic distribution. So an easy study would be to look at the strength of their depolarization. Another easy armchair ApJ Lett would be to re-create the Singal plots, but leaving out the nonthermal galaxies (no hidden Quasars), which should be fairly isotropic and whose removal should make the z < 0.5 bin look more like the other bins. Back.
21 Note that this large
anisotropy or at least absorption of
[O III]  5007 differs
markedly from the situation in the Seyfert sample discussed in
Sec. 1.4.
Back.
5007 differs
markedly from the situation in the Seyfert sample discussed in
Sec. 1.4.
Back.
22 One can also see this effect to some extent in the closely related top parts of Fig. 8 from Cleary et al 2007. Back.
23 Marchesini et al (2004) present a proxy for this test which could be made without IR data. Using line emission to estimate bolometric luminosities for radio galaxies, they found a probable gap in L / LEdd at ~ 0.01. Back.
24 In luminosity-luminosity plots of AGN (radio loudness vs. optical power is an example of an exception), you will almost always see a correlation because more powerful objects tend to have more of everything. When I retire I'll make a plot of the number of bookstores vs. the number of bars in US cities and towns - I predict at least an "astronomical-quality" correlation, which does not mean however that readers like to drink. Flux-flux plots have their own peculiarities, but they are different peculiarities than in luminosity-luminosity. Two other very common statistical errors that drive me crazy are: 1. in plots of the form A vs. A/B (or B/A), which are very common, the correlation slope, which may be intrinsically zero, will be strongly biased towards a positive (negative) value - it is not a discovery when this happens, if the ordinate range due to errors and population dispersions isn't much smaller than the range of the "correlation." People actually publish plots like this all the time, then go as far as analyzing these spurious slopes and trying to extract physics from them. 2. Survival statistics are often used to deal with upper limits, but most astronomical data sets violate the key requirement for this method: that the limits have the same distribution as the detections. In astronomy, we tend to have the exact opposite case: that the upper limits are usually concentrated towards the bottom of the distribution of detections! Back.
25 However, this in itself is still no proof that it's smaller than any possible torus. Back.
26 Another easy but worthwhile "armchair ApJ Letter" could be written to test whether restriction of the Donoso et al (2010) radio galaxies to those of high radio luminosity would cause their clustering properties to match those of the Quasars. Back.
27 One exception is found in Ramos Almeida, et al 2011. For a radio-quiet exception, see Filippenko 1984. Back.
28 An interesting possibility is that a large ISCO results from disk counter-rotation (Garofalo 2010). Back.
29 Optically thick, geometrical thin disks with the alpha viscosity prescription, e.g., Pringle 1981. Back.