

Within the Local Universe galaxies can be studied in great detail star by star. The Colour-Magnitude Diagram synthesis analysis method is well established, at optical wavelengths, as the most accurate way to determine the detailed star formation history of galaxies going back to the earliest times (e.g., Tolstoy et al. 2009). This approach has benefited enormously from the exceptional data sets that wide field CCD imagers on the ground and the Hubble Space Telescope can provide. Spectroscopic studies using large ground-based telescopes have allowed the determination of abundances and kinematics for significant samples of red giant branch (RGB) stars and also more massive O, B and A stars in several nearby galaxies (e.g., Tolstoy et al. 2009 and references therein). These studies have shown directly how properties can vary spatially and temporally, and how this information can give important constraints to theories of galaxy formation and evolution.
Dwarf galaxies are commonly used as probes of a simple "single cell"
star forming environment. They cover a range of mass and metallicity,
and are considered to be representative of how galaxies in the early
universe may have looked. A working definition of dwarf galaxies
includes all galaxies that are fainter than MB
 -16 (MV
-17) and more spatially extended than globular clusters (e.g.,
Tammann 1994),
see Figures 1 & 2.
Although these limits were not physically motivated, they are broadly
consistent with the limit of mass and concentration at which gas
outflows are likely to start to significantly effect the baryonic mass
of a galaxy. This includes a number of different types: early-type
dwarf spheroidals (dSphs); late-type star-forming dwarf irregulars
(dIs); the recently discovered very low surface brightness,
ultra-faint, dwarfs (uFd); as well as centrally concentrated actively
star-forming blue compact dwarf galaxies (BCDs). The newly discovered,
even more extreme, so-called ultra-compact dwarfs (UCDs) are
identified as dwarf galaxies from spectra but are of a similar
compactness to globular clusters (see purple crosses in
Figure 2). The dIs, BCDs, dSphs, late-type and
spheroidal galaxies tend to overlap with each other in global properties in
Figures 1 & 2. These
overlapping properties of early
and late-type dwarfs have long been assumed to be convincing evidence
that early-type dwarfs are late-type systems that have been stripped
of, or otherwise used up, their gas (e.g.,
Kormendy 1985).
-16 (MV
-17) and more spatially extended than globular clusters (e.g.,
Tammann 1994),
see Figures 1 & 2.
Although these limits were not physically motivated, they are broadly
consistent with the limit of mass and concentration at which gas
outflows are likely to start to significantly effect the baryonic mass
of a galaxy. This includes a number of different types: early-type
dwarf spheroidals (dSphs); late-type star-forming dwarf irregulars
(dIs); the recently discovered very low surface brightness,
ultra-faint, dwarfs (uFd); as well as centrally concentrated actively
star-forming blue compact dwarf galaxies (BCDs). The newly discovered,
even more extreme, so-called ultra-compact dwarfs (UCDs) are
identified as dwarf galaxies from spectra but are of a similar
compactness to globular clusters (see purple crosses in
Figure 2). The dIs, BCDs, dSphs, late-type and
spheroidal galaxies tend to overlap with each other in global properties in
Figures 1 & 2. These
overlapping properties of early
and late-type dwarfs have long been assumed to be convincing evidence
that early-type dwarfs are late-type systems that have been stripped
of, or otherwise used up, their gas (e.g.,
Kormendy 1985).
Thus, like larger systems, the global properties of dwarf galaxies correlate closely with luminosity, half-light radius and surface brightness, over a large range. Dwarf galaxies thus allow us to study specific aspects of galaxy formation and evolution on a small scale.
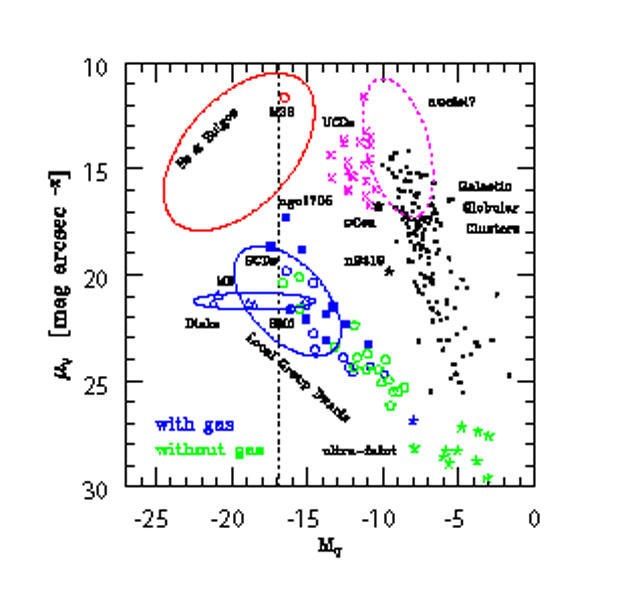 |
Figure 1. The relationship between the structural properties (absolute magnitude, MV and central surface brightness µV) for a range of different galaxy types. The dotted line is the classical maximum luminosity of the dwarf galaxy class, from Tammann (1994). Local Group galaxies are plotted as open pentagons, with the colour depending upon their gas content. The Sloan discovered ultra-faint systems as plotted as star symbols. Blue Compact Dwarf galaxies are squares, Ultra-compact systems as crosses and Galactic globular clusters as dots. See Tolstoy et al. (2009) and Binggeli (1994) for more details. |
 |
Figure 2. The relationship between the structural properties (absolute magnitude, MV and half-light radius rh) for a range of different galaxy types. The dotted lines are the classical maximum luminosity of the dwarf galaxy class, and the minimum spatial extent, from Tammann (1994). The symbols are the same as in Figure 1. See Tolstoy et al. (2009) and Belokurov et al. (2007) for more details. |