


There are increasingly significant difficulties in obtaining and accurately interpreting the CMDs of galaxies at distances beyond the Local Group, see Fig. 3. It is only possible to observe galaxies star by star in the very nearby Universe (predominantly within the Local Group), meaning that there are selection effects that will almost certainly bias our conclusions from these types of studies. The main uncertainty is due to the fact that we can only study the star formation history (SFH) back to the earliest times within the halo of the Milky Way and in very nearby galaxies, see Figure 3 and also Cignoni & Tosi (2010). These galaxies have most likely suffered significant evolutionary effects, as suggested by the morphology-density relation (e.g., Mateo 2008). It will be hard to remove this bias in our observations until a significant leap in sensitivity and resolution can be made to allow us to look to greater distances with comparable accuracy (e.g., a large space telescope or an extremely large ground based telescope working near to its diffraction limit).
 |
Figure 3. The effect of distance on the
resolution of individual stars and on the corresponding look-back time,
|
Main Sequence star luminosities have a clear age dependence, and are thus by far the most accurate age indicators of a resolved stellar populations as part of the full fitting of the colour-magnitude diagram (e.g., Aparicio & Gallart 2004). The fact that a stellar population is resolved down to the oldest main sequence turnoffs (MI ~ 3) means that the luminosity bias that is so apparent in integrated light studies can be largely removed. A significant amount of effort has gone into this kind of work from both large format CCD observations of very nearby galaxies (e.g., Hurley-Keller et al. 1998, Harris & Zaritsky 2009, de Boer et al., in prep.), which are large on the sky and also from deep HST observations for more distant systems (e.g., Skillman et al. 2003, Cole et al. 2007, Monelli et al. 2010).
Because the number and range of galaxy types in the Local Group is strongly biased to dwarf galaxies, this is the main type of galaxy studied with this detail. Dwarf galaxies are also more straight forward to observe a large fraction of the system in "one shot" even with HST. There have been numerous detailed studies of individual dwarf galaxies (e.g., Tolstoy et al. 2009 and references therein). There has also been a project to treat uniformly a large set of archival HST WFPC2 observations of Local Group galaxies, and create accurate star formation histories in a consistent manner (Dolphin et al. 2005, Holtzman et al. 2006). There have also been challenging studies of compact systems with extreme crowding, like M 32 (Monachesi et al. 2010), backed up by RR Lyr studies (Fiorentino et al. 2010). There have also been deep observations of small HST fields in the M 31 halo (e.g., Brown et al. 2003) and LMC (e.g., Holtzman et al. 1999, Smecker-Hane et al. 2002).
To look at currently more actively star forming systems, for example Blue Compact Dwarfs we need to look beyond the Local Group (e.g., NGC 1569 at 3.4 Mpc, see Grocholski et al. 2008, McQuinn et al. 2010), see Fig. 3. As we get more distant, it becomes harder to detect anything other than bright stars, and the photometric errors tend to smear out the features of the CMD. Going from left to right in Figure 3 it can be seen that the features in the CMDs become less and less well defined. This is mostly due to photometric errors due to the increasing faintness of the stars, but the related effect of increasing crowding, that makes it difficult to accurately disentangle the measurements of (faint) individual stars from their neighbours. Often there are clearly a large number of stars present above the tip of the RGB in BCD galaxies (e.g., NGC 1569). These may be either the effects of crowding, or they may indicate the presence of AGB stars and that a significant amount of star formation has occurred a few Gyr ago.
Of course this difficulty in detecting faint (blue) main sequence turnoff stars may have an obvious alternative in the presence of bright red AGB stars in imaging of galaxies extending to distances well beyond the Local Group (e.g., Girardi et al. 2010). However, without a better calibration of the effects of age and metallicity on the AGB population it is hard to quantify their presence in terms of an accurate star formation rate at a given time (e.g., see also VII Zw 403, Lynds et al. 1998). The CMDs in do not always give a good overview of the very red stars, such as AGB stars in these galaxies. This is because they do not always stand out very clearly in optical CMDs. What is really needed are infra-red observations of this population, and colour-colour diagrams can be especially useful (e.g., Cioni & Habing 2003, Gullieuszik et al. 2007), see Figure 4. These populations can then be calibrated in terms of ages and metallicities coming from optical imaging and spectroscopy.
In Fig. 4 we look at the star formation histories and also the number of AGB stars (as seen in IR colour-colour diagrams) in three nearby galaxies with a range of luminosity (from Mv = -14.8 → -11.7) and also a range of mean metallicity ([Fe/H] = -1 → -1.4) at the time the AGB stars were born. These three galaxies (NGC 147, Fornax dSph & Leo A) were chosen because they have very similar star formation histories, with a peak around 3-5 Gyrs. In each case the absolute rate at the peak is quite different. The more luminous the galaxy, the higher the peak star formation rate. But they all had their peak activities at a similar period in the past. The number of C-stars (AGB stars) that can be seen in the colour-colour diagrams varies by a larger amount than the SFR differences might imply, especially in the case of NGC 147. This might suggest that an important factor is also the metallicity at which the stars were forming 3-5 Gyr ago (these are also labelled in Fig. 4). The C-stars in Leo A still need to be carefully studied. These would likely be the most metal poor C-stars in the Local Group, if confirmed, given that the present day HII region abundance is a mere 3% of solar (van Zee et al. 2006). The stars in the C-star region of the colour-colour diagram for Leo A look more untidy than the usual AGB sequence, and my well be the result of confusion or young (massive) stars in HII region.
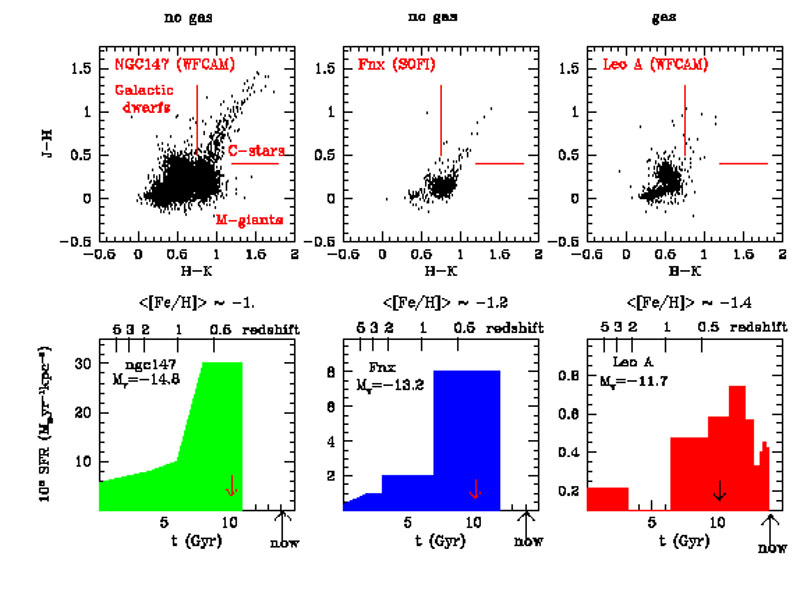 |
Figure 4. In the top panels are the Infra-Red colour-colour diagrams for three dwarf galaxies: NGC 147 (WFCAM data, over 0.8 sq deg, Irwin et al. in prep), Fornax dSph (SOFI data, over 0.1 sq deg, Gullieuszik et al. 2007) & Leo A (WFCAM data, over 0.8 sq deg, Irwin et al. in prep). The different stellar evolution phases that are delineated in an accurate colour-colour diagram sequences are labeled in the left most diagram. The C-stars (or AGB stars) and the M-giants are in the galaxy itself. The rest of the stars are predominantly Galactic dwarf stars. In the lower panels are the corresponding star formation histories for the same three galaxies, from Dolphin et al. (2005) (NGC 147); Tolstoy et al. (2001) (Fnx) and Cole et al. (2007) (Leo A). |
When you look at the SFHs of dwarf galaxies as a group there is no discernible trend in either duration or average age of stellar population with either mass, luminosity or rotation, they seem to reach a similar luminosity by distinct routes (e.g., Skillman 2007). The only effect seems to be that when a galaxy forms stars, everything else being equal, the maximum rate seems proportional to the mass of the galaxy, that is to the total number of stars formed, but not when they formed. How the number of evolved stars (e.g., carbon stars, or E-AGB stars) fits into SFH has not yet been clearly quantified. The number of AGB stars should be studied for a range of galaxies using the accurate SFHs from deep optical data where available to better understand if it is possible to disentangle the effects of age, metallicity and small number statistics in the interpretation of their properties.
 , of the star formation
history. The CMDs are in absolute magnitude (MI) and colour of
systems all observed for long exposure times with the HST and
photometered with the same techniques, but at different distances. The
, of the star formation
history. The CMDs are in absolute magnitude (MI) and colour of
systems all observed for long exposure times with the HST and
photometered with the same techniques, but at different distances. The