


6.1. A consistent picture of galaxy evolution?
To gain a broader view of the time evolution of action in the Universe the evolving galaxy UV luminosity function discussed in section 4.1 can be integrated (over luminosity) to yield the evolving comoving UV luminosity density. This might be of academic interest were it not for the fact that this quantity can, in principle, be converted into star-formation density, to gain a global view of the evolution of star-formation activity per unit comoving volume over cosmic time.
This calculation has been performed by many authors over a wide range of redshifts since being first promoted by Lilly et al. (1996) and Madau et al. (1996). It is, however, a calculation fraught with danger as it involves (and can depend critically upon) several extrapolations; the galaxy luminosity function has to be correctly extrapolated to the lowest luminosities, the stellar mass function has to be correctly extrapolated to the lowest masses, and any mass and/or time dependence of the obscuring effects of cosmic dust has to be correctly accounted for and removed. In addition, care has to be taken to account for highly-obscured populations which may be entirely missed in UV-selected galaxy samples.
A full review of the many, and continually-improving studies of cosmic star-formation history is obviously beyond the scope of this z > 5 review. However, to place the high-redshift results in context, it is fair to say that there is now broad agreement that star-formation density rises by an order of magnitude as we look back from z = 0 to z = 1, increases by a further factor of 2 or 3 by z ≃ 2, and then appears to plateau out to z ≃ 3 before declining at still higher redshifts (see e.g. Hopkins & Beacom 2006; Dunlop 2011). This evolution is shown in Fig. 23 (taken from Bouwens et al. 2011b), but this particular figure has been deliberately designed to focus on the apparently smooth and steady decline of star-formation density from z ≃ 3 to z > 8.
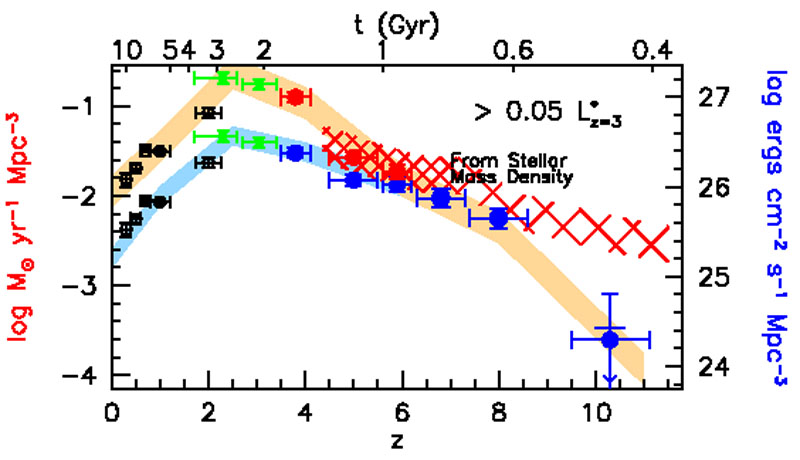 |
Figure 23. A compilation of UV luminosity density measurements, and hence inferred evolution of cosmic star-formation rate density as presented by Bouwens et al. (2011b). The data-points at z = 4 - 8 are basically based on integrating the luminosity functions described in Fig. 11 down MUV ≃ -18 AB mag, while data points at lower redshift from Reddy & Steidel (2009), Bouwens et al. (2007) and Schiminovich et al. (2005) are provided for context. The blue data points and lower shaded regions indicate UV luminosity density prior to any correction for dust obscuration. The upper locus indicates the effects of correcting for redshift dependent dust onscuration which, as apparent, is assumed here to decline to zero by z ≃ 7 following Bouwens et al. (2009b). The red hatched region is intended to indicate the SFR density derived from differentiating the growth in stellar mass density delineated below in Fig. 24. Results at z > 8 are probably not meaningful, as the stellar mass density is based on an assumed extrapolation, while the z ≃ 10 datapoint is based on the single z ≃ 10 galaxy in the HUDF claimed by Bouwens et al. (2011a) and additional tentative upper limits based on non detections (Oesch et al. 2012). (courtesy R. Bouwens) |
Crucial to the precise form of this plot is the assumed strength and redshift dependence of typical dust obscuration as a function of redshift, which in this case is assumed to decline from a factor of ≃ 7 at z ≃ 2 to essentially zero at z ≃ 7. The true redshift dependence of dust extinction in LBGs of course remains a matter of debate, but several independent pieces of evidence point towards a high-redshift decline (e.g. Fig. 13), and even with dust corrections it is hard to escape the conclusion that SFR density is significantly lower at z ≃ 7 than at the peak epoch corresponding to z ≃ 2 -3.
Finally, it is worth noting that while the datapoint at z ≃ 10 should probably be taken with a pinch of salt (but see also Oesch et al. 2012), the decline in SFR density from z = 4 to z = 8 is in fact fairly precipitous when viewed in terms of the ≃ 1 Gyr of elapsed cosmic time. Current observations of the high-redshift UV LF thus support the view that we are witnessing the rapid emergence of the star-forming galaxy population.
6.1.2. The growth of cosmic stellar mass density
An alternative route to determining the cosmic history of star-formation is provided by integrating the evolving galaxy stellar mass functions (over stellar mass) to map out the build-up of comoving stellar mass density with cosmic time. In principle this can be used as a check on the validity of the assumptions (concerning, for example, dust) used to estimate cosmic star-formation history as described above, because the stellar mass density in place at any epoch should (modulo some stellar mass loss) equate to the time integral of all preceding star-formation activity. At z > 5 these calculations are arguably still premature. However, given data of sufficient quality, they may in fact be more straightforward and less uncertain than at more modest redshifts, principally because serious dust obscuration may be less of a problem in the young, relatively metal-poor Universe.
Fig. 24 shows a compilation of recent determinations of stellar mass density at high redshift taken from González et al. (2011), with the dark-green pentagons in effect being based on integration of the stellar mass functions shown in Fig. 18 (again down to MUV ≃ -18, for ease of comparison with Fig. 23). Despite the well-documented uncertainties in current measurements of the stellar mass function at early times, this figure indicates that there is now reasonably good evidence for a smooth, monotonic rise in the integrated stellar mass density with decreasing redshift. Moreover, while there have in the past been some problems in reconciling the growth in stellar mass density with the directly observed SFR density (e.g. Wilkins, Thretham & Hopkins 2008), this situation has improved (e.g. Reddy & Steidel 2009), and the reasonable agreement seen here between the time differential of Fig. 24 with the SFR density plotted in Fig. 23 (as indicated by the red hatched region) arguably provides some confidence that neither measurement is too far off. It also suggests that fears the IRAC fluxes from many z ≃ 7 galaxies are dominated by extreme nebular emission lines (rather than starlight) may have been somewhat exaggerated (Schaerer & Barros 2010; see also McLure et al. 2011).
 |
Figure 24. Stellar Mass Density as a function of redshift for sources brighter than M1500 = -18 as derived by González et al. (2011). These stellar-mass density values were produced by integrating the mass functions shown in Fig. 18 to M1500 = -18 at z = 4, 5, 6, and 7. Shown for compariso are the stellar-mass density determinations from from Stark et al. (2009) corrected to the same M1500 = -18 limit. The low-redshift open circles were derived by integrating the Marchesini et al. (2009) mass functions between 8.3 < log10 Mstar / M⊙) < 13 and multiplying by 1.6 to match the Salpeter IMF. A constant SFH and 0.2 Z⊙ metallicity was assumed to derive all stellar masses at z ≥ 4. The effect of a possible 20% correction due to contamination by Hα is shown, as is the effect of using a different IMF. The integrated mass growth shown here is well described by log10(SMD) ∝ (1 + z)-3.4 ± 0.8 (courtesy V. González). |
It is however, probably premature to conclude that the agreement is sufficiently good to support the assumption of zero dust obscuration at high redshift, especially given the current limitations in constraining the low-mass end of the stellar mass function at z > 4. Deeper HST data will undoubtedly help further progress in this area, as of course will the higher resolution mid-infrared imaging to be delivered by JWST (see section 7).
6.2.1. Current constraints on reionization
A second arena in which the integrated UV luminosity density of the evolving high-redshift galaxy population is of interest is in the study of cosmic reionization. The reionization of the hydrogen gas that permeates the Universe was a landmark event in cosmic history. It marked the end of the so-called cosmic "dark ages", when the first stars and galaxies formed, and when the intergalactic gas was heated to tens of thousands of degrees Kelvin from much smaller temperatures. This global transition had far-reaching effects on the formation of the early cosmological structures and left deep impressions on subsequent galaxy and star formation, some of which almost certainly persist to the present day.
The study of this epoch is thus arguably the key frontier in completing our understanding of cosmic history, and naturally the focus of much current research. Nevertheless, despite the considerable recent progress in both theory and observations (for recent reviews see Robertson et al. (2010), McQuinn et al. (2010)) all that is really established about this crucial era is that it was completed by redshift z ≃ 6 (as evidenced by the Gunn-Peterson troughs in the spectra of the most distant quasars; Fan et al. 2006) and probably commenced around z ∼ 15 (as suggested by the latest WMAP microwave polarisation measurements, which favour a mean redshift of reionization of 10.4 ± 1.4; Komatsu et al. 2009). However, as discussed by Dunkley et al. (2009), within these bounds the reionization history is essentially unknown, and with current data we cannot even distinguish whether it was "sharp" or extended.
Unsurprisingly, therefore, understanding reionization is one of the key science goals for a number of current and near-future large observational projects. In particular, it is a key science driver for the new generation of major low-frequency radio projects (e.g. LOFAR, MWA and SKA) which aim to map out the cosmic evolution of the neutral atomic Hydrogen via 21-cm emission and absorption. However, radio observations at these high redshifts are overwhelmingly difficult, due to the faintness of the emission and the very strong foregrounds, and in any case such radio surveys cannot tell us about the sources of the ionizing flux.
A key and interesting question, then, is whether and when the apparently rapidly evolving UV-selected galaxy population is capable of delivering enough ionizing photons per unit time per unit volume which can escape from their host galaxies to reionize the inter galactic medium.
6.2.2. The galaxy population at z ≃ 7, and the supply of reionizing photons
Clearly the complete ionization of hydrogen in the intergalactic medium requires sustained sources of Lyman continuum photons with wavelengths λ < 912 Å (corresponding to the ionization energy of ground-state hydrogen, E > 13.6 eV). If the emerging population of young faint galaxies revealed in the HST surveys is responsible for reionizing the Universe then, as discussed by many authors, the process of reionization should, at least in broad terms, follow their time-dependent density (e.g. Robertson et al. 2010; Trenti et al. 2010). However, it is not straightforward to establish the number density of ionizing photons delivered by galaxies at z ≃ 6 - 10, because they are essentially unobservable due to the fact they are absorbed by neutral hydrogen (as they must be if they are doing their job of reionizing the hydrogen gas). We are therefore forced to infer the number density of ionizing photons from the observable evolving UV luminosity density at λrest ≃ 1500 Å, coupled with estimates of the rate of ionizing photons produced per unit solar mass of star-formation activity, and an estimate of what fraction of the ionizing Lyman-continuum photons produced by young stars can actually escape their host galaxies to help with reionization of the surrounding inter-galactic medium (fesc).
Finally, we also require some knowledge of the "clumpiness" (C) of the inter-galactic medium in the young Universe. For the IGM to be ionized simply requires that recombinations are balanced by ionizations. The recombination rate depends on the IGM temperature and the physical hydrogen density which declines with time according to the universal expansion factor R(t)-3 ∝ (1 + z)3. However, it is enhanced in locally overdense regions by the clumping factor C = < nH2 > / < nH >2 (i.e. C = 1 corresponds to a uniform IGM). Early cosmological simulations indicated that the IGM clumping factor at z ≃ 6 could be as high as C ≃ 30 (e.g. Gnedin & Ostriker 1997) making reionization difficult due to self-shielding within dense clumps. However, more recent simulations suggest that the IGM clumping factor lies in the range 1 < C < 6, making reionization easier to achieve (e.g. Bolton & Haehnelt 2007; Pawlik, Schaye & van Scherpenzeel 2009)
An illustration of current constraints on the ability of galaxies to reionize the Universe at z ≃ 7 is shown in Fig. 25 (adapted from Robertson et al. 2010). This is based on our current knowledge of the galaxy LF at this epoch, an assumed IGM clumping factor C = 2, a production rate of ionizing photons per unit star formation of 1053.5 s-1 M⊙-1 yr, and alternative escape fraction assumptions of fesc = 0.1 and fesc = 0.2 (values for fesc which at least have some tentative support from observations at z ≃ 3; Shapley et al. 2006, Iwata et al. 2009). All of these numbers remain highly uncertain, but it can be seen that for these, arguably not unreasonable assumptions, confirmation that the z ≃ 7 LF of McLure et al. (2010) continues to rise steeply down to H ≃ 30 AB mag may be sufficient to prove that the emerging population of young galaxies could have reionized the Universe by z ≃ 7. Of course this conclusion would become even more secure if the even steeper faint-end slope in the LF favoured by Bouwens et al. (2011) (see section 4.1) is confirmed, and especially if more accurate determinations of the UV-slope parameter β favour high escape fractions (see section 5.3). This provides strong motivation for the even deeper HST WFC3/IR observations in the HUDF planned in the UDF12 project in summer 2012 (HST programme GO-12498).
 |
Figure 25. Did Galaxies Reionize the Universe? Expected constraints on the rate of ionizing photons dnion / dt, from the combination of the HUDF and on-going CANDELS HST surveys. The shaded regions show a 3σ uncertainty in the UV luminosity density ρUV and the improvement made possible via the planned deeper 29.9(AB) (stacked J140 + H160) UDF12 imaging program. The light and dark grey regions show the ρUV ranges necessary to maintain reionization for escape fractions fesc = 0.2 and 0.1 respectively (for other assumptions see Robertson et al. 2010) (courtesy B. Robertson). |
In addition, Fig. 25 conservatively assumes that we only count up the photons from the observable galaxies which, for the H160 ≃ 30 limit of the planned HST imaging, corresponds to an absolute magnitude limit of M1500 ≃ -17. Extrapolation to still fainter luminosities will provide yet more ionizing photons, especially if the LF remains steep, and even more so if escape fraction rises with decreasing luminosity. However, it is currently unclear how far down in luminosity one can safely integrate. At low redshifts, GALEX imaging in the Coma and Virgo clusters suggests a turnover in the LF around MUV ≃ -14 (Hammer et al. 2012; Boselli et al. 2011) corresponding to a deficit of dwarfs below masses of 108 M⊙, while the field UV LFs appear to keep rising to fainter magnitudes (≃ -11; e.g. Treyer et al. 2005). However, the relevance of these low-redshift results is unclear, given that Schechter function fits at low-redshift yield a faint-end slope of only α = -1.4.
If the new HST imaging continues to strengthen the argument that galaxies could have reionized the Universe by z ≃ 7, then attention will shift to the issue of how to reconcile such relatively late reionization with the WMAP results.
Additional information on the progress of reionization can be gleaned from observations of Lyman α emission from high-redshift galaxies, which have the potential to inform us about the ionization state of the IGM as a function of redshift.
This work complements detailed analyses of Lyman-α emission from high-redshift quasars, where studies of the size of proximity zone (i.e. the ionized region) around, for example, the z = 7.085 quasar LAS J1120+0641 (whose spectrum was shown in Fig. 2), have been used to argue that the IGM is significantly more neutral at z ≃ 7 than at z ≃ 6.5 (Mortlock et al. 2011; Bolton et al. 2011). The problem with such studies of very bright, but hence very rare objects is that it is hard to know whether the sightline is typical, and it is also hard to decide whether a small proximity zone may simply refect the fact a given quasar has only recently turned on. Thus, while observations of Lyman-α emission from the much fainter galaxy population are obviously much more challenging, they offer the prospect of statistically representative results based on multiple sightlines.
As already discussed in detail in section 4.3, and as concisely described by Finlator (2012), a partially neutral IGM has the effect of scattering the Lyman-α emission from a galaxy into a low surface brightness halo, and this has several measurable consequences which, for convenience, I summarize again briefly here.
First, the luminosity function of LAEs may evolve. However, as discussed in sections 4.2 and 4.3, the interpretation of current measurements of the evolving LAE LF is complicated by the fact any evolution seen reflects a mix in the underlying evolution of the galaxy mass function, evolution in the intrisic ISM of the galaxies, and the desired signature of the evolving IGM. This complication, coupled with the very poor constraints currently available on the form of the LAE LF at z ≃ 7, mean that it appears too early to attempt to draw any definitive conclusions on the progress of reionization from this work.
Second, the Lyman-α escape fraction should evolve. As explained in section 4.3.3, follow-up spectroscopy of objects selected as LBGs has, in principle, the ability to cleanly separate the evolution of the underlying galaxy population from the evolution of Lyman-α escape fraction. These observations are being keenly pursued, and current indications are that average Lyman-α escape fraction increases out to z ≃ 6, but that this trend shows signs of reversal at z ≃ 7 (Pentericci et al. 2011; Schenker et al. 2012; Ono et al. 2012). In addition, tentative claims have been advanced that this drop in escape fraction is more dramatic for faint objects than for bright ones, and that this may indicate reionization proceeds from high- to low-density environments, as suggested by an inside-out reionization model (Ono et al. 2012). However, the spectroscopy at z ≃ 7 is challenging, and current results are somewhat controversial and based on very small samples. Moreover, the z ≃ 6 baseline against which it can be judged is still in the process of being properly pinned down (Curtis-Lake et al. 2012). Nevertheless, continued work in this area has the potential to yield relatively clear-cut results, and should be enormously aided by the advent of the new generation of multi-object near-infrared spectrographs, as summarized below in section 7.
Third, the mean shape of the Lyman-α line emission from galaxies should evolve, as any increasing neutral; fraction impacts on the blue side of the Lyman-α line more than the red. However, current contraints on this are necessarily confined to stacking measurements, and to date have proved inconclusive (e.g. Ouchi et al. 2010).
Finally, the clustering of LAEs should increase with redshift as we look back into the epoch of reionization. If galaxies produced the photons that reionized the IGM, then their clustering should have influenced the history of reionization, and the first galaxies are certainly expected to have been highly clustered. Specifically, by the time the neutral fraction of hydrogen has dropped to ≃ 50%, the average ionized region is expected to have a radius of ≃ 10 Mpc (comoving), created and maintained by many hundreds of small galaxies working in concert. Because a Lyman-α photon redshifts out of resonance after travelling ≃ 1 Mpc, most Lyman-α emission produced by the galaxies which together have created this bubble should emerge unscathed (i.e. unscattered) by the IGM. Consequently, as illustrated by the state-of-the-art simulations shown in Fig. 26, the clumpy nature of reionization means that LAEs are predicted to appear more clustered than LBGs during the reionization epoch. Indeed, under some scenarios the apparent clustering of LAEs can be well in excess of the intrinsic clustering of halos in the concordance cosmology. Observing such enhanced clustering would confirm the prediction that the HII regions during reionization are large (McQuinn et al. 2007). This prediction has arguably gained some tentative observational support from the latest large-area surveys for Lyα emitters at z ≃ 6.5, where it has been found that, depending on luminosity, the number density of LAEs varies by a factor of 2-10 between different ≃ 1/4 deg2 fields (Ouchi et al. 2010; Nakamura et al. 2011). However, Ouchi et al. (2010) report no evidence for any significant clustering amplitude boost at z ≃ 6.6, and it seems clear that the meaningful search for this effect must await surveys of large samples of LAEs and LBGs at z > 7 covering many square degrees.
 |
Figure 26. Left Early structure formation in ΛCDM (at z = 6) from an N-body simulation with 54883 (165 billion) particles and (425 h-1 Mpc)3 volume. Shown are the dark-matter density (pink) and halos (blue). This synthetic image corresponds to 3.5 × 3.5 degrees on the sky. Right: The geometry of the epoch of reionization, as illustrated by a slice through a (165 Mpc)3 simulation volume at z = 9. Shown are the density (green/yellow), ionized fraction (red/orange), and ionizing sources (dark dots) (courtesy I. Iliev). |