


High-resolution ultraviolet observations in the nearby universe, both imaging and spectroscopy, are one of the major legacies of HST. The main UV spectrographs on HST were designed to have high resolving powers, which necessitated either small entrance apertures or the use of narrow slits. The natural consequence is that while HST spectra may be rich with features, any measurements strictly reflect the properties of the stars and gas that fall within the aperture. In most cases these will be the regions of highest UV surface brightness, which in general will be unobscured massive stellar clusters. However it is not necessary that these local properties, whether regarding Lyα or interstellar gas, are representative of the entire galaxy. Thus we must always keep in mind that HST derived measurements of gas kinematics, densities, and covering, such as those discussed in this Section, are local.
The first-generation instrument, the Goddard High Resolution Spectrograph (GHRS) increased the resolving power over that of the IUE (R ∼ 250) by a factor of 10–100. This enabled studies of the kinematics and covering of the atomic gas which are topics completely absent from discussion in every previous paper presenting IUE data. Furthermore, with the IUE observers needed to target galaxies at high enough radial velocity to separate the intrinsic Lyα feature from the bright Lyα line produced in the Earth's corona, which is brighter than any known extragalactic object. Indeed because of the tentative anticorrelation between WLyα and metallicity, Meier & Terlevich, 1981 already commented upon how it was unfortunate that the lowest metallicity galaxy known – I Zw 18, with 12 + log(O/H) ≈ 7.2 – had at too small a redshift to be observed with IUE, for logically it must be very bright in Lyα. With HST/GHRS it could finally be observed.
4.1. HST Finds Deep Lyα Absorption
GHRS observations of I Zw 18 revealed a profile showing only damped Lyα absorption and no hint of emission (Kunth et al., 1994). The Lorentzian wings of the absorption profile can be traced out to at least 6000 km s−1 (Figure 3; Mas-Hesse et al., 2003), implying a Hi column density above several 1021 cm−2. Furthermore, measurements of the low ionization stage (LIS) metal lines that form in the neutral ISM (e.g. Oi λ1302, Siii λ1304) show that the Hi gas is static with respect to to the Hii regions, and at the measured column density Lyα radiation at line-centre will have to traverse 107 optical depths in order to escape if the Hi is homogeneous.
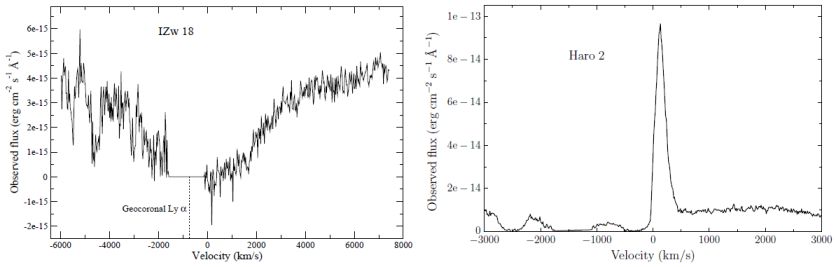 |
Figure 3. The Lyα spectra of first dwarf galaxies to be observed in the far UV with HST. The left panel shows I Zw 18, first observed with GHRS by Kunth et al., (1994). The geocoronal Lyα line has been masked out and is shown by a line set to zero flux at velocities of −500 to −2000 km s−1. No intrinsic Lyα emission is seen, and damping wings are visible that extend to at least 6000 km s−1. Figure is taken from Mas-Hesse et al., (2003). The right panel shows Haro 2, first observed by Lequeux et al., (1995). Haro 2 has a much higher dust abundance than I Zw 18, but shows a strong Lyα emission line. Furthermore the line profile is P Cygni-like, which indicates the intrinsically produced frequencies have been redistributed by scattering in an expanding neutral medium. Data are replotted from Mas-Hesse et al., (2003). |
Subsequent observations of I Zw 18 with the Space Telescope Imaging Spectrograph (STIS) enabled detailed, spatially resolved, and empirically well-constrained studies of Lyα radiative transport, which indeed shows that this profile can be reproduced, including spatial variation in the damping wings, using column densities of NHI ∼ 3 × 1021 cm−2, and EB−V = 0.05 (Atek et al., 2009b). This is fully consistent with the directly observed values on both NHi and EB−V. Moreover the same transport simulations predict that for static gas with this Hi column density, almost all the Lyα radiation is absorbed by the small amount of available dust (escape fraction the order of 10−4 to 10−3), as many scattering events increase the probability of absorption.
With the HST servicing mission 4, the Cosmic Origins Spectrograph (COS) was installed on HST. COS has a similarly sized entrance window to GHRS and similar grating specifications, but can observe much larger wavelength range in a single observation, and is many times more sensitive. Recently obtained COS observations of I Zw 18 enable us to go much deeper than was previously possible, and a COS/G130M exposure of 29 ksec actually does reveal a small bump of Lyα emission, hidden at the bottom of the absorption profile (Figure 4; see also Lebouteiller et al., 2013, James et al., 2014). The Lyα emission feature lies in the centre of the absorption trough, and the flux amounts to just ≈ 4 × 10⁻¹⁶ erg s−1 cm−2. Recalling at this point that HST spectrographs measure only very local properties, we would need to make a large aperture correction to estimate the total Lyα output. However assuming an exponential Lyα surface brightness profile we would need a scale length of 80 arcsec in order for 100% of the Lyα to be emitted (integrating to infinity). While this is not ruled out – Hi is extends over at least a square arcmin (van Zee et al., 1998) – this scale length is 40 times the UV effective radius, which is an extreme extension of Lyα compared with other nearby objects (Section 5). The alternative is that a large fraction of the Lyα photons are absorbed by dust after numerous scattering events, as suggested by Atek et al., (2009b).
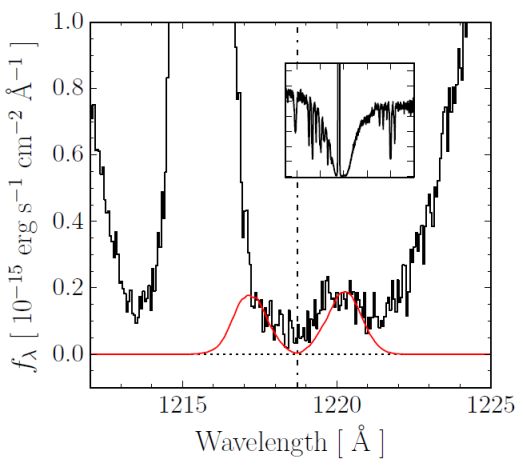 |
Figure 4. Very deep Lyα spectrum I Zw 18 obtained with the Cosmic Origins Spectrograph. While previously referred to as a Lyα absorbing galaxy, I Zw 18 shows a very small but significant bump of Lyα emission. This bump is redshifted from the expected systemic velocity (the dot-dashed vertical line) derived from the Hα line. The overlaid red line shows the profile of Lyα transferring through a static shell of atomic hydrogen with a column density of log(NHI / cm−2) = 21.1, taken from the Schaerer et al., (2011) grid of transfer models. The strong emission feature is the geocoronal Lyα emission line. The inset shows the wider spectral profile. |
In I Zw 18 the Lyα bump is also offset from the systemic velocity (measured from Hα) by 350 km s−1 while the neutral gas shows bulk velocities of −10 km s−1 (measured from Siii). The bulk motion is insufficient by an order of magnitude to kinematically redshift the Lyα by such a velocity, so other physical processes must be at play. The red line in Figure 4 shows a radiative transport model produced by the grid of Schaerer et al., 2011, for a completely static and dust-free Hi shell with a column density log(NHI / cm−2) = 21.1, which is within 0.25 dex of previous estimates based upon modeling just the absorption feature. A plausible interpretation is that the bump is the red half of a double-peaked profile, which results from wing scattering events that shift photons in frequency many Doppler widths into the redistribution profile. If so, and the scattering medium is completely static, there would be a corresponding blue peak at –350 km s−1; this however would be hidden below the geocoronal Lyα line, that swamps any intrinsic emission.
Observations of similar dwarf galaxies show the deep Lyα absorption seen in I Zw 18 is not unique. Two of the other most metal-deficient galaxies known, SBS 0335-052 and Tol 65 (Thuan & Izotov, 1997), have metallicities just a factor of 2 higher than I Zw 18. Both also show broad Lyα absorption profiles with equivalent widths of −20 to −30 Å, no hints of Lyα emission, and clear damping wings that imply Hi column densities above 2 × 1021 cm−2. Similar deep absorption is visible in the COS spectrum of low-metallicity dwarf SBS 1415+437 (James et al., 2014, 12 + log(O/H) ≈ 7.6), which also shows a similarly redshifted bump of Lyα in emission. These galaxies are very rare in the local universe, and one may question whether far-reaching conclusions may be drawn from them. Nevertheless, such objects may become more abundant at higher redshifts, and any complete theoretical picture of Lyα must also include them.
4.2. Galaxy Winds and Atomic Gas Kinematics
In contrast to the strongly absorbing dwarfs the second BCG with a published HST Lyα spectrum, Haro 2, was found to emit a strong Lyα line with WLyα ≈ 7Å (emission part only, Lequeux et al., 1995, right part of Figure 3). This is particularly curious because Haro 2 is an order of magnitude more dust- and metal-rich than the dwarf galaxies. Comparing with the absorbing BCDs discussed in Section 4.1, the total column density of hydrogen along the line-of-sight is roughly the same, but with two important differences. Firstly, much less of that hydrogen column density is contributed by the neutral phase, although the measured column of NHi ≳ 1020 cm−2 would still be sufficient to cause a damped absorption. Secondly, the absorption centroid of Lyα is blue-shifted by ≈ 200 km s−1 relative to the systemic frame of rest of the galaxy. The result of this first resolved observation of a Lyα emission line is an asymmetric profile that comprises a blue absorption component and a red emission peak, similar to the P Cygni profile. Even though the wing of the absorption profile is quite extended, the velocity offset is sufficient to shift the neutral medium partially out of resonance with Lyα, and enable some of the Lyα radiation to escape.
The LIS lines intrinsic to Haro 2 were also found to be blue-shifted with respect to the systemic velocity and by the same velocity as measured from the Lyα absorption (≈ 200 km s−1). The peak of the Lyα emission, however, is instead redshifted by 350 km s−1, or roughly twice the blueshift of the neutral medium. This led Lequeux et al., (1995) to suggest that much of the Lyα is able to avoid Hi absorption in Haro 2 because it does not see the atomic gas as static, and the redshifted Lyα emission supports a picture in which the Lyα that is emitted is ‘backscattered' from a receding shell of Hi gas (Verhamme et al., 2008). Furthermore in Haro 2, diffuse soft X-ray emission covers and extends beyond the UV-bright, star-forming regions, which is produced by the mechanical energy released by the star formation episode (Otí-Floranes et al., 2012). This X-ray emission is spatially consistent with an extension of the Lyα emission in the 2D spectral image. In contrast I Zw 18, which shows only Lyα absorption and static low-ionization absorption lines, is undetected at soft X-ray energies (Ott et al., 2005). The conventional picture for galaxy outflows is that cold gas is accelerated by expanding hotter gas (e.g. Strickland et al., 2004), which supports scenario where feedback-driven outflows promote the emission of Lyα.
This early picture easily generalized in a sample of eight local BCGs observed by Kunth et al. (1998), four of which show net Lyα in emission and four absorption. For those with net absorption, their Oiλ 1302 and Siiiλ 1304 absorption lines lie close to the systemic velocity (within 25 km s−1), while the other four show outflowing gas with centroid velocities shifted by 60–180 km s−1 (see also Leitherer et al., 2013). This correlation does not necessarily imply a causal relationship and the fact that Lyα is seen to be locally emitted where outflows are strong could also be explained also by orientation: transport models show more Lyα to be emitted perpendicular to galaxy disks purely because of the Hi distribution (Verhamme et al., 2012, Laursen et al., 2013), and winds are also stronger in the polar direction because the pressure is also lower (e.g. Bland & Tully, 1988, Veilleux & Rupke, 2002). More compelling evidence for a causal association comes from the fact that all the Lyα emission lines in the sample show P Cygni-like asymmetric profiles, indicating that photons are interacting directly in the outflowing medium. For this, it is much harder to argue for a non-causal relation.
Galaxies in the Kunth et al., (1998) sample were originally chosen to span a range of metallicities and dust contents, but both of these quantities were found to be secondary in governing Lyα emission/absorption when compared to the presence/absence of outflowing neutral gas.
COS Lyα observations of local galaxies are ongoing, but already the instrument has far outdone the GHRS in terms of numbers. Using larger samples of both FUV-selected (Heckman et al., 2011) and Hα-selected objects (Wofford et al., 2013) this picture of kinematic regulation easily has strengthened. For galaxies in the ‘Lyman-break analog' (LBA) samples of Heckman et al., 2011 P Cygni emission is ubiquitous while for the Hα-galaxies, redshifted Lyα peaks and LIS lines blueshifted by around 100 km s−1 are found among the emitters, while absorption lines (including Lyα) consistent with zero velocity shift at 68% confidence are exhibited by the absorbers.
Similar results are found among the Lyman alpha Reference Sample (LARS; Section 5.2; Rivera-Thorsen et al., 2015), which are summarized in the lower panels of Figure 5. The left-most panel shows an example where the ISM in front of the brightest nuclear star cluster (where the COS aperture is positioned) is static, and from where broad damped Lyα absorption is also observed. From other regions of the galaxy, however, Lyα emission is recovered and the galaxy becomes a weak Lyα emitter (WLyα ≈ 10Å) in apertures that encompass the galaxy. The central panel shows an example where the neutral ISM is outflowing along the line-of-sight by around 250 km s−1, the Hi absorption is similarly blueshifted, and a weak Lyα emission feature is visible within the pointing of the COS. The right panel instead shows a galaxy where the atomic gas is outflowing at higher velocity still, and a very bright Lyα emission line is visible with WLyα ≈ 40Å (80 Å when including extended emission).
 |
Figure 5. Example images and Lyα spectra of local galaxies. Upper panels show colour composite images, encoding Hα in red, FUV continuum in green, and Lyα in blue. Dotted white lines indicate the size and position of the COS aperture. Lower panels show the corresponding spectra around Lyα (dark blue) and Siiiλ 1260Å (red). Objects are selected to illustrate the variety of Lyα and LIS profiles. Note the different velocity scales, which extend to ± 7000 km s−1 in the left-most frame but just ± 1500 km s−1 in the other two. The left object, LARS 09, shows a completely absorbed Siii profile that is centred at zero velocity. This absorbing gas removes 300 km s−1 (FWHM) in the Siii line but completely damps the Lyα line, resulting in a FWHM that is 20 times broader. The centre plot, LARS 08, shows a similarly broad and saturated Siii profile, but one that is offset in velocity by ∼ −250 km s−1. The blue wing of the Lyα absorption profile shows a similar shape and is offset in a similar way to the left panel, but in this case a redshifted Lyα line is emitted. The right panel shows a an example of a strong Lyα-emitter, in which the Siii absorption is blueshifted by ≈ 350 km s−1, is far from saturated, and a very bright Lyα emission line is seen. |
Obviously if all neutral gas can be cleared from zero velocity, then Lyα should escape unhindered. For the column densities probed using the Siii lines, this appears to be the case in the right panel of Figure 5, where only more tenuous gas appears to remain at Δv ≈ 0 to absorb Lyα. Yet removal of cold gas from Δv ≈ 0 not a requirement for Lyα emission, and ivera-Thorsen et al., 2015 present several examples of galaxies that show strong Siii absorption at Δv = 0, but also significant Lyα emission (their Figure 8). However while there is clearly gas that does not have a velocity shift, the centroids of the absorption profiles are offset – usually by ≲ −50 km s−1 – which demonstrates that there is fast-moving gas that can Doppler shift Lyα out of resonance with the static material. Additional support for this comes from the fact that the peak of the Lyα profile is redshifted in every case.
Figure 6 summarizes the situation, by showing the average velocity shift of low-ionization absorption lines compared with WLyα measured in the same aperture (diameter of 1.9 and 2.5 arcsec with GHRS and COS, respectively). Outflow velocities span a range from −250 to +50 km s−1 (net inflow), with a median value of −50 km s−1. No galaxy with low-ionization gas moving in the velocity range −50 to +50 km s−1 shows significant Lyα emission: all but two of these objects show either net absorption or emit Lyα with a total EW below 3 Å. However galaxies with faster outflowing gas show a wide range of WLyα, which reaches up to 40Å, with an average near 10Å. We can state with confidence that at least on small scales Lyα emission is correlated with feedback of sufficient magnitude, that acts to accelerate the highest density neutral ISM along the line-of-sight. Note, however, that this does not mean it is the case that all galaxies with a strong outflow are Lyα emitters – clearly there are galaxies with Δv ≈ −150 km s−1 and WLyα below 2 Å. Furthermore while the correlation exists, the causal mechanism by which feedback affects the transport has not necessarily been established. For example, whether feedback is simply shifting the Lyα out of resonance by scattering from bulk-flowing gas, or the instigation of fluid instabilities that disrupt the ISM.
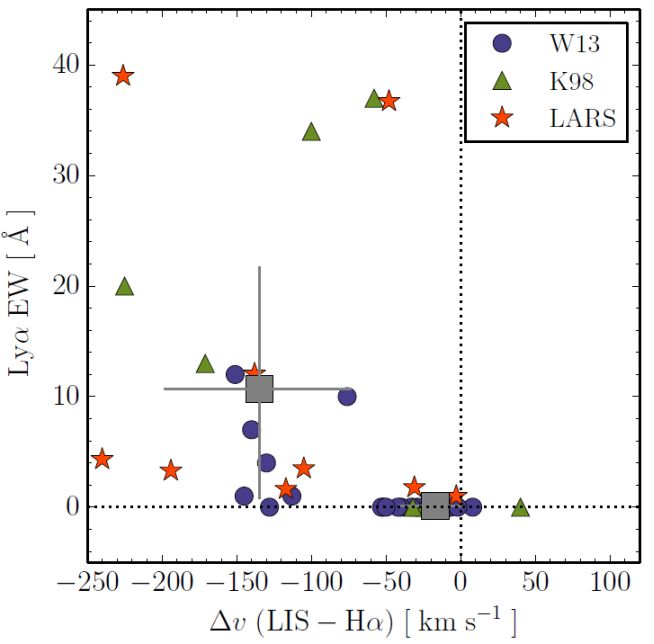 |
Figure 6. The relationship between WLyα and outflow velocity of the atomic gas. All measurements are made within spectroscopic apertures with HST/GHRS and COS. Where the Lyα absorption component dominates over emission WLyα is set to zero. Δ v is calculated from the average of velocity centroids of all observed LIS lines compared with the intrinsic velocity of the nebulae measured from optical emission lines. A cut of Δv = −50 km s−1 divides the sample in half by Δv, segregating galaxies with fast outflows from those with weakly outflowing, static, or inflowing neutral media. Grey points with errorbars represent the average and standard deviation of galaxies of these two sub-samples. |
4.3. Dissecting the Neutral Medium in Detail
In addition to gas kinematics, the plethora of resonance absorption lines in the UV also provide a proxy for the fractional covering of the cold Hi medium (e.g. Savage & Sembach, 1996, Pettini et al., 2002). The principle is simple: strong resonance transitions are assumed to be saturated at normal metallicities and column densities, and thus if the absorbing line does not drop to the level of zero intensity then the observation hints that there may be multiple clouds inside the spectroscopic aperture that do not fully cover the stellar sources of continuum radiation that lie beneath. Thus if there are direct sightlines between the observer and the ionized regions, Lyα may escape unimpeded, and importantly, without frequency shift. Indeed if scattering could be completely mitigated and dust confined to the cold gas phase, fescLyα should be at least 1−fc, where fc is the Hi covering fraction.
These methods have been used to place indirect limits on the escape of ionizing radiation from starburst galaxies (Grimes et al., 2009, Heckman et al., 2011), and have recently been verified by direct observations in the ionizing continuum with HST/COS (Borthakur et al., 2014). Similar tests, verified against Lyα emission, have been conducted at high-z (e.g. Jones et al., 2013) and low-z COS studies focussed on Lyα recently been presented. For the majority of local UV-selected galaxies the depth of the normally-saturated Siii lines indicates a covering fraction close to unity. However there is some deviation from this: a weak trend is seen for galaxies with fescLyα above 0.1 to be drawn from systems with Siiiλ 1260 Å absorption lines that are not saturated (Rivera-Thorsen et al., 2015). Very well exposed continuum observations are needed to solve for covering fraction, but solutions include the possibility of fc < 1 for the thickest gas neutral columns in Lyα-emitting galaxies but not in the case of absorbing systems.
Many of the resonant UV transitions, including the Siii discussed above, have an associated fluorescent transition at longer wavelength, denoted with a * (e.g. C ii*), that provide additional diagnostics of the atomic medium (Prochaska et al., 2011, Rubin et al., 2011, Jaskot & Oey, 2014, Scarlata & Panagia, 2015). Since the absorption lines are resonant, they may be partially filled by scattered radiation, very similarly to Lyα. However, the fluorescent transition associated with each line has a roughly similar Einstein A coefficient to the resonant de-excitation, which implies that roughly half of absorbed photons should be emitted in the longer wavelength * line at every scattering. In a symmetric, energy-conserving system without losses, absorption along the sightline must be balanced by isotropic fluorescent emission.
Jaskot & Oey, 2014 recently presented spectra of two particularly interesting bright Lyα emitters, with WLyα between 70 and 150 Å. Both of these objects are well-detected in the stellar continuum, but absorption lines of Ciiλ 1334 and Siiiλ 1260Å lines are barely visible. However the fluorescent counterpart of each transition is clearly seen in emission, suggesting that the ISM is indeed partly covered or shows a low Hi column density in these galaxies. A similar spectrum is that of LARS 14, illustrated in the lower-right panel of Figure 5 (Rivera-Thorsen et al., 2015), which shows a bright Lyα line with a blue peak, incomplete Siii absorption, and a fluorescent emission line (seen at relative velocity of +1200 km s−1).
Further information may be inferred from the profiles of Lyα. While Lyα and Siiiλ 1260 have cross sections of the same order of magnitude and become optically think at similar column density, the metal abundances imply that Lyα may be absorbed by gas that is not visible to metal absorption. Particularly in the galaxies of Jaskot & Oey, 2014 and LARS 14, the Lyα lines do not resemble the strongly asymmetric absorption+emission of P Cygni profiles that occur at high column densities of completely covered gas. Instead they show double-peaked profiles with narrow absorption at Δv = 0. This indicates that there must be absorbing Hi that is not Doppler shifted, but that is also not of sufficient column density and/or metallicity to be seen in metal absorption lines. This implies NHi between 1015 and 1018 cm−2 for normal ranges of metal abundance.