


Are HST spectroscopic studies are performed in small apertures or narrow slits. Even for the most distant objects discussed so far, the 2.5 arcsec entrance window of COS corresponds to a physical size of just 6 kpc, and obviously the apertures will sample much smaller scales in more nearby galaxies (e.g. just 130 pc in I Zw 18). Thus while providing a very rich picture about Lyα and the ISM, spectroscopic measurements are restricted to the chosen sightlines: as shown in Figure 5, these will sample only a fraction of the galaxies. These small apertures are necessary to get the high spectral resolution, but to capture a representative fraction of the Lyα they are likely far too small, particularly when considering that Lyα can scatter. To get this, spectroscopic observations must be complimented with large-aperture imaging.
Thick columns of neutral gas have been observed in most of the starbursts mentioned so far, and spectroscopic data strongly suggest that scattering removes Lyα from the line-of-sight. An important question becomes whether the bulk of the absorbed Lyα is truly absorbed, or simply scattered to larger radii from where it is subsequently emitted. Such information is vital for the comparison with high-z data, where ordinarily a flux and EW measurement may be available but little more, and standard practice is to adopt small aperture appropriate for point sources (∼ 1−2 ′′).
Lyα imaging at z = 0 became efficient with HST when the Advanced Camera for Surveys (ACS) was installed. Although it was technically possible with earlier cameras, the Solar Blind Channel of ACS has a total throughput of a few percent, and made such observations feasible for the first time. Not only did this bring about the first resolved information on Lyα (aside from very extended high-z Lyα-blobs), but also an immediate leap to an angular resolution of ≈ 0.1 arcsec. However galaxies still need to be sufficiently redshifted in order for Lyα not to be absorbed my Milky Way Hi (cz ≳ 2500 km s−1 is sufficient) so obvious targets such as very well-studied nearby systems such as M82 or M33 still cannot be observed.
The first Lyα images revealed a range of morphologies. Near the central starbursts, Lyα is seen in both emission and absorption, where it may vary between the two on sub-kpc scales with little obvious dependence upon local properties such as age or reddening. For example the first starburst with a photometrically calibrated Lyα image, ESO 338-IG04 (Hayes et al., 2005), shows a lane of Lyα absorption that runs approximately E–W, and loops around one side of the galaxy only. This is seen at no other wavelength. In other regions jets of brighter Lyα fuzz are visible, again seeming uncorrelated with obvious signs of Lyα production such as Hα emission. Obviously spectroscopic results will be a strong function of aperture placement. Furthermore, as soon as ACS was turned towards local starbursts, Lyα halos were discovered to surround the starbursting regions (Atek et al., 2008, Östlin et al., 2009). I now proceed to discuss the results of small-scale resolved analyses and extended Lyα halos, beginning with a case study of one system.
5.1. Resolved Analyses: A Case Study of Haro 11
Local luminous BCG Haro 11 is a Lyman break analog (e.g. Grimes et al., 2007), and emits Lyα with a total EW of 15 Å. As shown in Figure 7, it comprises three main star-forming knots (labeled in the FUV image), all of which are bright in the UV and Hα, but only one of these condensations emits Lyα (Hayes et al., 2007). Following this breakdown of the galaxy, knots A and B (the west-most two) are by far the brightest in Hα and must produce the bulk of the Lyα radiation, but both absorb at Lyα. In contrast it is only the single easterly knot C, which is the faintest of the three in Hα but brightest in the UV, that locally emits its Lyα. Haro 11 also emits a halo of Lyα emission, centred around knot C, which can most easily be explained if Lyα is re-radiated after scattering in the surrounding neutral gas. Diffuse emission also surrounds the two easterly knots, but at the positions of the clusters absorption outweighs the emission, giving a negative overall flux. While the Lyα surface brightness of the halo is low, it is also very much larger than the UV continuum-bright regions, and in total contributes ≈ 90 % of the total Lyα flux (Hayes et al., 2007). Results inferred from small-aperture spectroscopic observations will be a strong function of both the size and placement of the aperture.
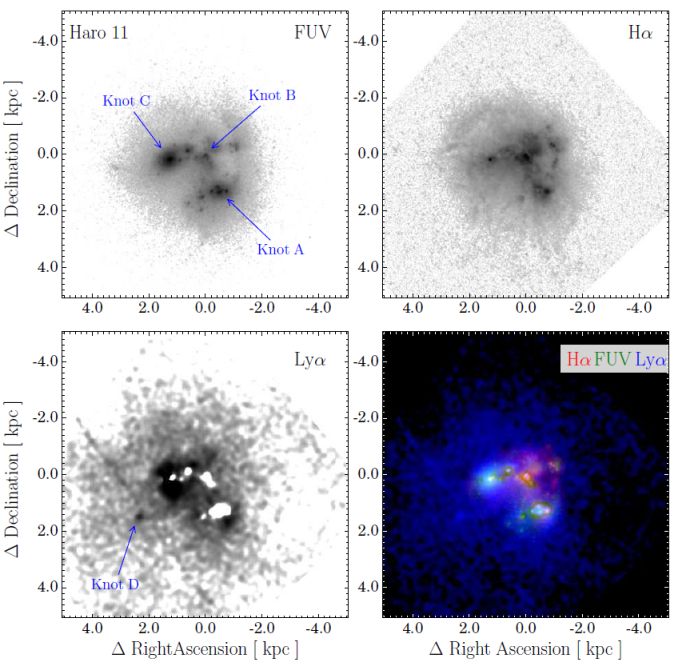 |
Figure 7. HST/ACS imaging of luminous blue compact galaxy Haro 11 (Kunth et al., 2003, Hayes et al., 2007). Upper Left: far UV continuum; Upper Right: continuum-subtracted Hα; Lower Left: continuum-subtracted Lyα. The Lower Right panel shows a composite of the other three images, with Hα in red, FUV in green, and Lyα in blue. The physical scale in kpc is shown on the axes. In the FUV image, the three main star-forming condensations (knots A, B, and C) are labeled in the nomenclature of Vader et al., 1993; the Lyα-emitting clump with no detection at any other wavelength (Knot D in Kunth et al., 2003) is labeled in the Lyα image. |
In Haro 11, Lyα produced in knots A and B may still be emitted, and all the observation can say is that more radiation from the stellar continuum is absorbed locally than the sum of directly emitted Lyα and any Lyα scattered into the line-of-sight. Thus for a given pixel we still cannot say whether Lyα is scattered and absorbed by dust locally, or whether it propagates some kpc and contributes to the halo emission. Remarkably in this three-region decomposition of Haro 11, is that the strongly emitting knot C is also the dustiest, and shows EB−V ≈ 0.4 magnitudes, while knot A in particular is far less extinguished (Atek et al., 2008). Under the simplistic assumption that dust plays a dominant role in regulating Lyα visibility, this would be unexpected, although results from these Lyα absorbing knots are reminiscent of the dwarf galaxies discussed in Section 4.
Similar phenomena were noted throughout the sample of nearby galaxies first observed with ACS. Specifically ESO 338-IG04 was also found to exhibit a diffuse Lyα halo that dominates the Lyα output (Hayes et al., 2005), and in a small sample of six local starbursts, global Lyα emission is invariably associated with large-scale halo emission (Atek et al., 2008, Östlin et al., 2009).
 |
Figure 8. Comparison of Lyα and Hα surface photometry for Haro 11. The abscissa shows the logarithmic Hα surface brightness, measured in individual pixels in the HST images, while the ordinate axis shows the corresponding surface brightness in Lyα. I.e. contours show the density of points when comparing pixel values in the frames from Figure 7. The red line shows the case B recombination line ratio of Lyα = 8.7 × Hα; intrinsically astrophysical nebulae produce Lyα and Hα radiation that follow this line. The plot is logarithmic, so only Lyα emitting regions can be visualized. Histograms above and to the right show the overall the distribution of light emitted as a function of surface brightness. |
Nebulae produce Lyα radiation intrinsically at an intensity of 8.7 times that of Hα (Section 2), but when we contrast the local surface brightnesses of the two lines a very wide range of line ratios is found. These are illustrated in Figure 8, which contrasts the Hα and Lyα surface brightness in Haro 11 pixel-by-pixel. We now discuss various regions of the diagram:
• a. Lyα can be emitted with fluxes similar to those expected from recombination. In Figure 8 above log Lyα surface brightness of ≈ −12.8, a region of proportionality is seen between Lyα and Hα that falls right on top of the expectation value for Case B. These pixels correspond to knot C in Figure 7. Since this region of points is well defined and rather narrow, it can most easily be understood as Lyα photons leaving the galaxy with little interaction with surrounding Hi. Lyα photons emitted in these regions were most likely produced here.
• b. Lyα can be emitted with fluxes below those expected from recombination. The preponderance of points in Figure 8 lie below the case B line. This can be the result of two factors: Lyα can be absorbed by dust, decreasing the Lyα / Hα ratio (just as the Balmer decrement increases with dust in nebulae), or Lyα can be scattered out of the line-of-sight by Hi. I.e. dust and Hi scattering act to move points down from the red line. Recall, also, that in this logarithmic plot Lyα absorption cannot be visualized and more pixels are to be found at negative values of Lyα.
• c. Lyα can be emitted with fluxes above those expected from recombination. Toward the upper left region of the diagram, Lyα / Hα exceeds the value of 8.7 expected for Case B. In this example, some pixels are 10 times brighter in Lyα than expected. This happens only at lower Hα surface brightness, and here Lyα is spatially redistributed from elsewhere and emitted after scattering in the neutral ISM, resulting in the halo phenomenon discussed above and in the following section. Thus some of the Lyα that shows Lyα / Hα ≲ Case B (point b) must be scattered and not simply attenuated by dust.
Early imaging observations showed that in galaxies with net Lyα emission, the dominant fraction comes from a component of large-scale extended emission that surrounds the star-forming regions. Indeed upwards of 50% of the Lyα is typically emitted in halo regions that extended at least 10 kpc from the UV-bright clusters (Hayes et al., 2005, Atek et al., 2008), and in some galaxies this is the only Lyα that emerges. The first large-scale Lyα imaging survey of local starbursts – the Lyman alpha Reference Sample (LARS, Östlin et al., 2014) – has shown that extended halos are near ubiquitous in Lyα emitting galaxies (Hayes et al., 2013). Moreover LARS has enabled the first systematic survey of the sizes of these halos and the comparison with other wavelengths.
Continuum-subtracted Lyα images show a wide range of morphologies. Typically they do qualitatively resemble those of the UV and Hα, but are more extended, and envelop the galaxies. On average halos have twice the linear size in Lyα that the galaxy does in either the UV stellar continuum or Hα (Figure 9, Hayes et al., 2013). These estimates are made using the depth and redshift independent Petrosian radii, which are found to be below 15 kpc in Lyα for LARS galaxies, with a median value of 5 kpc. Furthermore, the extension of the Lyα surface (ξLyα, the ratio of Lyα radius to Hα radius) is not an independent quantity, and is correlated with a number of measured properties: notably ξLyα is anti-correlated with dust abundance, as demonstrated by the lower panel of Figure 9, and Lyα extension is found to be larger at lower metallicity and stellar mass. Radiative transfer simulations (using Verhamme et al., 2012) show that this effect cannot be reproduced simply varying the dust content and what gives rise to these extended halos is currently unclear. Pardy et al., (2014) have shown that higher ξLyα is produced by galaxies with narrower 21 cm line-widths, but not the total mass in Hi (which neglecting mergers correlates with the line-width), possibly indicating that lower mass galaxies with less complex large-scale morphologies are the ones in which Lyα scatters to the largest relative distances.
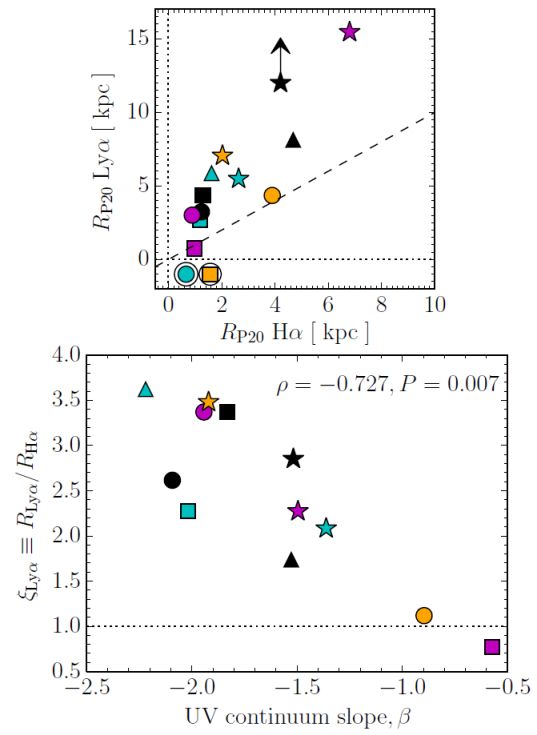 |
Figure 9. Extension of Lyα halos in the LARS sample; figure is taken from Hayes et al., (2013). The upper panel shows the Petrosian radius measured in Lyα plotted against that measured in Hα. The two galaxies that globally absorb Lyα are set to negative size. The dashed line shows the 1-to-1 line, and Lyα is on average twice the linear size of Hα. The lower panel shows the relative extension of Lyα compared to Hα, ξLyα. This example shows how the extension is anti-correlated with the UV continuum slope, β, which is commonly used as a proxy for the dust content in galaxies. |