


The flux densities listed in Columns 2 and 4 of Table 7 are the average of measurements taken at the two weightings (robust 0 and the robust 0 with a uv-tapering applied). Our measurements avoided disconnected point-like features immediately around the source but did include anything that might be considered an ’extension’ (at this point it is unknown whether the extension is indeed related, or not). For example, NGC 3448 shows clearly a point source at C-band, but the same is not visible as a distinct source at L-band. The error (Columns 3 and 6), which is the difference between the two weightings, also encompasses inclusion vs non-inclusion of such point sources. In most cases, however, the calibration error (flux density scale accuracy) which is estimated to be about 2% 14 is larger than this error. The error columns in the table cite the larger of the two uncertainty estimates.
For some cases, such as NGC 5907, a background source is visible through the disk - in such cases, the flux density from these sources has been removed from the total flux density measurement.
Our new flux density values are the best so far at these two frequencies (cf. Paper I).
Star formation rates and "surface densities" (see below) are based largely on WISE (Wright et al. 2010) 22-µm images with resolution enhanced over the standard survey products to a final value of 12.4" via the WERGA (WISE Enhanced Galaxy Resolution Atlas) process (Jarrett et al. 2012, Jarrett et al. 2013). WERGA images in all four WISE bands were kindly provided by T. Jarrett. Foreground stars were removed through PSF subtraction in the WERGA pipeline. Backgrounds/foregrounds are relatively uniform, although one galaxy showed a significant jump in background level at 22 µm close to the galaxy but not crossing it. A constant background was therefore subtracted. Flux densities were measured with apertures large enough to include all emission from each galaxy and converted to Jy using conversions given in the WISE Explanatory Supplement (Cutri et al. 2011). Flux densities from any background sources were subtracted. Three corrections to the flux densities, as described by Jarrett et al. (2013) are applied; an aperture correction for extended sources, a small colour correction appropriate for dusty, star-forming galaxies, and a calibration correction at 22 µm appropriate for spiral galaxies. Formal uncertainties on the flux densities are small, and the final uncertainties include a 1.5% flux calibration uncertainty (Jarrett et al. 2013), although by far the biggest source of uncertainty in the SFR is the galaxy distance. No corrections were made for extinction.
Spitzer MIPS 24-µm images (Rieke et al. 2004), at a resolution of 5.9" and with a range of sensitivities, were found in the NASA/IPAC Infrared Science Archive for 16 of our galaxies, and will mostly be used in future work, but are employed for one purpose below – hence, their reduction is also described here. The "pbcd" mosaics produced by the standard MIPS pipeline reduction were found to have low-level "jailbars" in most cases. We therefore reformed the mosaics from the individual "bcd" images via "self-calibration" (dividing each bcd image by the median of all images) with the MOPEX software. This procedure removed the jailbars very well. No other image artifacts were noted. Multiple resulting mosaics were added to produce final images. Background gradients were then subtracted with the IRAF program background.
Jarrett et al. (2013) have shown that WISE 22-µm fluxes (ν Fν) correlate extremely well with Spitzer 24-µm fluxes for their sample of 17 nearby galaxies, allowing star formation rate calibrations developed for the latter by Rieke et al. (2009) to be applied to the former. We therefore use the relation between 22-µm ν Lν and SFR given by Jarrett et al. (2013) to calculate SFRs, except for NGC 4388 where the Rieke et al. (2009) relation is used.
Fig. 3 shows the same 22 vs 24µm flux relation for the CHANG-ES galaxies with MIPS images, and its obvious correlation further encourages this approach.
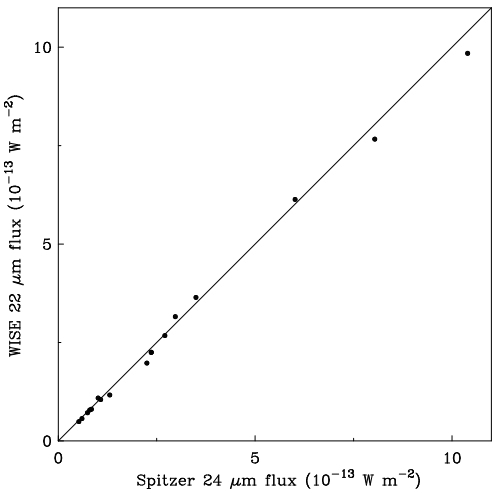 |
Figure 3. WISE 22 µm vs. Spitzer 24 µm flux (ν Fν) for the 16 CHANG-ES galaxies with archived Spitzer 24 µm images. The line is not a fit to the data but shows equality of the two fluxes. |
To measure 22-µm galaxy isophotal diameters, we formed a major axis profile averaged over a 13" minor axis extent, and measured the diameter where the flux had dropped to three times the typical uncertainty level in the images. This flux level is 15.7 µJy/arcsec2. A measure of the star formation rate surface density was then calculated by assuming disk axisymmetry and dividing the SFR by the isophotal disk area. Flux densities, angular diameters, SFRs and SFR surface densities are listed in Table 6.
| Galaxy | Flux density | Flux | Diameter | Diameter | SFR | SFR surface density | Uncertainty |
| [Jy] | [× 10-13 W/m^2^] | ['] | [kpc] | [Modot/yr] | [× 10-13 Modot/yr/kpc2] | ||
| (1) | (2) | (3) | (4) | (5) | (6) | (7) | (8) |
| N660 | 5.70 | 7.77 | 3.02 | 10.8 | 2.74 | 29.96 | 0.02 |
| N891 | 5.90 | 8.04 | 9.50 | 25.1 | 1.55 | 3.13 | 0.02 |
| N2613 | 0.99 | 1.35 | 4.95 | 33.7 | 1.73 | 1.94 | 0.02 |
| N2683 | 0.74 | 1.01 | 5.15 | 9.39 | 0.09 | 1.34 | 0.02 |
| N2820 | 0.28 | 3.80 | 1.78 | 13.8 | 0.62 | 4.20 | 0.02 |
| N2992 | 0.88 | 1.19 | 1.27 | 12.5 | 3.22 | 26.13 | 0.03 |
| N3003 | 0.33 | 4.46 | 3.75 | 27.7 | 0.67 | 1.11 | 0.02 |
| N3044 | 0.73 | 9.91 | 3.07 | 18.1 | 0.95 | 3.70 | 0.02 |
| N3079 | 2.56 | 3.50 | 4.33 | 26.0 | 3.46 | 6.54 | 0.02 |
| N3432 | 0.54 | 7.42 | 3.63 | 9.96 | 0.15 | 1.97 | 0.02 |
| N3448 | 0.48 | 6.59 | 1.75 | 12.5 | 0.92 | 7.55 | 0.02 |
| N3556 | 3.43 | 4.68 | 6.08 | 24.9 | 2.17 | 4.44 | 0.02 |
| N3628 | 4.41 | 6.02 | 9.90 | 24.5 | 1.01 | 2.15 | 0.02 |
| N3735 | 0.84 | 1.14 | 2.82 | 34.4 | 1.10 a | 1.2 a | 0.02 |
| N3877 | 0.92 | 1.25 | 3.58 | 18.5 | 0.92 | 3.43 | 0.02 |
| N4013 | 0.59 | 7.98 | 3.45 | 16.1 | 0.48 | 2.35 | 0.02 |
| N4096 | 0.79 | 1.08 | 3.92 | 11.8 | 0.27 | 2.46 | 0.02 |
| N4157 | 1.62 | 2.21 | 3.67 | 16.6 | 1.25 | 5.77 | 0.02 |
| N4192 | 0.96 | 1.31 | 6.20 | 24.4 | 0.56 | 1.19 | 0.02 |
| N4217 | 1.14 | 1.55 | 3.90 | 23.4 | 1.53 | 3.57 | 0.02 |
| N4244 | 0.38 | 5.22 | 11.53 | 14.8 | 0.02 | 0.14 | 0.03 |
| N4302 | 0.44 | 6.00 | 3.82 | 21.6 | 0.53 | 1.45 | 0.02 |
| N4388 | 2.18 | 2.97 | 2.30 | 11.1 | 0.07 b | 0.72 b | 0.02 |
| N4438 | 0.19 | 2.64 | 1.32 | 3.98 | 0.07 | 5.35 | 0.03 |
| N4565 | 1.65 | 2.25 | 10.43 | 36.1 | 0.74 | 0.73 | 0.02 |
| N4594 | 0.62 | 8.44 | 5.97 | 22.0 | 0.32 | 0.83 | 0.02 |
| N4631 | 7.62 | 1.04 | 10.85 | 23.4 | 1.33 | 3.10 | 0.02 |
| N4666 | 3.03 | 4.13 | 4.03 | 32.3 | 7.29 | 8.92 | 0.02 |
| N4845 | 0.52 | 7.14 | 2.10 | 10.4 | 0.48 | 5.68 | 0.02 |
| N5084 | 0.06 | 7.73 | 0.73 | 4.99 | 0.10 | 5.04 | 0.05 |
| N5297 | 0.24 | 3.33 | 2.20 | 25.9 | 1.27 | 2.41 | 0.02 |
| N5775 | 1.99 | 2.71 | 3.80 | 32.0 | 5.28 | 6.58 | 0.02 |
| N5792 | 0.82 | 1.12 | 2.57 | 23.7 | 2.63 | 5.98 | 0.02 |
| N5907 | 1.73 | 2.36 | 7.35 | 35.9 | 1.56 | 1.54 | 0.02 |
| U10288 | 0.11 | 1.51 | 2.15 | 21.3 | 0.41 | 1.15 | 0.03 |
| Note. - Col. 1: Name; Col. 2 and 3: 22 µm flux, given in two diferent units (The values in Col. 3 were used for Fig. 3); Col. 4 and 5: Angular diameters; Col.6: Star formation rates in solar masses/year; Col 7: Star formation rate density × 10-3 in solar masses/year and kpc2; Col. 8: Fractional error on surface density. | |||||||
| a The SFR and SFR surface density values of NGC 3735 were adjusted from 4.71 and 0.005 respectively, to the values given here (lower limits), in order to account for the central AGN (see Sec. 5.2.1) | |||||||
| b The SFR and SFR surface density values of NGC 4388 were adjusted from 1.91 and 0.020 respectively, to the values given here (lower limits), in order to account for the central AGN (see Sec. 5.2.1) | |||||||
| Galaxy | Flux density C | Flux density C uncertainty | Flux density L | Flux density L uncertainty |
| (1) | (2) | (3) | (4) | (5) |
| N660 | 657.9 | 13.2 | 525.4 | 10.5 |
| N891 | 208.7 | 6.9 a | 743.9 | 14.9 |
| N2613 | 15.3 | 0.3 | 59.6 | 2.4 a |
| N2683 | 20.3 | 0.8 a | 66.6 | 6.5 a |
| N2820 | 19.1 | 0.4 | 61.8 | 1.2 |
| N2992 | 80.4 | 1.6 | 204.9 | 4.1 |
| N3003 | 10.8 | 0.5 a | 34.9 | 0.7 |
| N3044 | 37.5 | 0.9 a | 104.2 | 2.1 |
| N3079 | 365.4 | 7.3 | 811.0 | 16.2 |
| N3432 | 26.3 | 0.5 | 83.3 | 1.9 a |
| N3448 | 20.5 | 0.4 | 46.0 | 0.9 |
| N3556 | 79.2 | 4.7 a | 291.5 | 5.8 |
| N3628 | 184.6 | 3.7 | 527.5 | 10.5 |
| N3735 | 24.9 | 0.5 | 81.3 | 1.6 |
| N3877 | 12.9 | 0.3 a | 42.7 | 0.9 |
| N4013 | 12.6 | 0.3 | 37.9 | 0.8 a |
| N4096 | 16.3 | 0.3 | 57.1 | 1.1 |
| N4157 | 55.1 | 1.1 | 184.5 | 3.7 |
| N4192 | 24.4 | 0.5 | 80.6 | 1.6 |
| N4217 | 35.4 | 0.7 | 111.5 | 2.2 |
| N4244 | 9.0 | 0.6 a | 18.1 | 0.6 a |
| N4302 | 12.0 | 0.3 a | 45.1 | 0.9 |
| N4388 | 62.2 | 1.2 | 130.9 | 2.6 |
| N4438 | 54.5 | 1.1 | 132.2 | 2.6 |
| N4565 | 42.3 | 1.1 a | 152.2 | 3.0 |
| N4594 | 128.3 | 2.6 | 93.7 | 1.9 |
| N4631 | 284.4 | 7.4 a | 1083.0 | 37.0 a |
| N4666 | 125.3 | 2.5 | 404.5 | 8.1 |
| N4845 | 432 | 8.6 | 230.0 | 4.6 |
| N5084 | 36.1 | 1.0 a | 40.7 | 0.8 |
| N5297 | 6.7 | 0.4 a | 24.4 | 0.5 |
| N5775 | 74.4 | 1.5 | 255.0 | 5.1 |
| N5792 | 20.2 | 0.4 | 57.7 | 1.2 |
| N5907 | 51.5 | 1.0 | 181.5 | 3.6 |
| U10288 | 1.53 | 0.5 b | 4.4 | 0.5 b |
| Note. - Col. 1: Name; Col. 2: Flux density C-band (mJy); Col. 3: Uncertainty of flux density C-band, in most cases 2% calibration errors; Col. 4: Flux density L-band (mJy); Col. 5: Uncertainty of flux density L-band, in most cases 2% calibration errors. | ||||
| a The error between the two weightings is larger than the 2% calibration error, and in these cases, we use the former. | ||||
| b For UGC 10288, we refer to Paper III. | ||||
About ten galaxies have bright nuclei at 22 µm, raising the possibility of significant AGN contamination. To give an idea of the potential contamination, we refer to the study of the AGN contribution to mid-IR continuum emission based on observations of the nuclei of nearby AGN by Tommasin et al. (2010). They find lower limits of 45-73% for the AGN contribution to the 19 µm continuum, depending on the type of AGN. For cases where we believe an AGN to be present, we crudely correct our SFRs by assuming that 100% of the nuclear 22 µm emission arises from the AGN. A literature search suggests that all ten candidates are starburst nuclei except for two, NGC 3735 and NGC 4388, with perhaps the most compelling evidence coming from the IR line ratio study of nuclei by Pereira-Santaella et al. (2010).
We explored this issue further by making a rough determination of the nuclear 3.4-4.6 µm colour from the WISE WERGA images, a measure which distinguishes well between AGN and starbursts (Jarrett et al. 2011, Fig. 26, and references therein). We estimated the colour of the central source in two different ways, both of which include simplifying approximations. The resolutions are 5.9" and 6.5" at 3.4 and 4.6 µm respectively. First, we fit a 2-D Gaussian with a constant background to the central peak in each band. We tried this with two different box sizes: 9" × 9" and 12" × 12". We then turned the flux density ratio of the Gaussians into a colour. The second method was to Gaussian-convolve the 3.4 µm images to the 4.6 µm resolution, make a colour map, and examine the colour in a central box of size 6" × 6". The reason these methods are approximate is first that the PSFs have significant Airy disks, so some of the flux density is not in the central peak and not described by a Gaussian, and second that a constant background is not necessarily the best assumption in the first method since the galaxy has structure as it cuts through the fitting box. However, the results are reasonably consistent from the two methods.
Although Fig. 26 of Jarrett et al. (2011) represents a range of redshifts, our resulting colours clearly fall into either the spiral/starburst or AGN regions, and the classifications are generally consistent with the evidence from the literature, with two exceptions.
The first exception is NGC 3735, which has a starburst-like nuclear colour of about 0.0-0.3 mag (the range is from the two different methods and shows the greatest discrepancy for any of the ten galaxies), whereas MIR line ratios from Pereira-Santaella et al. (2010) clearly indicate an AGN. In this case, we tend to favour the MIR over the NIR evidence because of the possibility of extinction hiding the NIR emission from the AGN in an edge-on geometry. If it is an AGN, we can only estimate the SFR by measuring the disk flux density outside a radius of 13". This reduces the SFR to 1.1 M / yr, although strictly this is a lower limit.
The second exception is NGC 660, where a colour of 1.2-1.3 clearly indicates an AGN. If indeed an AGN, the nuclear flux density can be crudely subtracted via a Gaussian fit to the central peak in the 22 µm image, leaving a lower limit SFR of 0.61-0.81 M/yr, depending on the fit parameters. Yet the literature (Pereira-Santaella et al. 2010, Bernard-Salas et al. 2009), indicates a starburst, as well as a LINER galaxy. Thus, we will continue assuming NGC 660 to be a starburst rather than AGN galaxy, and retain the originally derived values in Table 6.
The nucleus of NGC 4388 does appear to be AGN-dominated (Falcke et al. 1998), with a colour of 1.1 mag. The 22-µm flux density is dominated by this source, and the faint disk emission is not well resolved from it. Hence, to estimate the SFR, we turn to the Spitzer 24-µm image, where the disk is better resolved. However, in this case the nuclear source so overwhelms the disk that the uncertainty in the flux density of a Gaussian fit precludes an estimate of a disk SFR as was done for NGC 660. At best, we can crudely estimate a disk flux density outside a radius of 7" from the nucleus. Hence, the SFR of 0.07 M/yr is a lower limit.
5.3. Overview of the CHANG-ES sample ordered by SFR surface density
It has long been suspected that the extent of radio halos is related to SFR or SFR per unit area (SFR surface density) (e.g. Dahlem et al. 2006). As a preliminary ‘quick-look’ to see whether such ordering applies to the CHANG-ES sample, we have formed two maps displayed in Figures 4 and 5. These maps have been formed from the L-band primary-beam-corrected images 15. They have then been ordered by SFR surface density as described in the previous section, the latter quantity importantly being independent of distance.
It is important to keep in mind in this section, that in spite of the well-defined criteria used in the previous section, some starburst-classified galaxies may still have, in addition, hidden AGN contamination, and future examination of the CHANG-ES sample including higher resolution data sets should help to clarify this issue.
The first map (Fig. 4) is an attempt to bring all galaxies to a common distance of 10 Mpc so that their 1.6 GHz sizes can be compared. Each image was first rotated according to the Ks position angle provided in NED and then minor adjustments were made of order < |4∘| to produce better horizontal alignment. The galaxies were then scaled in size by the ratio, (D/(10 Mpc))2. Appropriate adjustments were made to ensure that the brightness (i.e. specific intensity) did not change during this process. The displayed beams (lower right hand corner of each panel) were scaled in the same way and, since the resolutions were all similar (though not identical) for the L-band data, a glance at these beams reveals the distances and linear spatial resolutions of the galaxies; the more distant galaxies have large beams after scaling, whereas the closer galaxies have small beams.
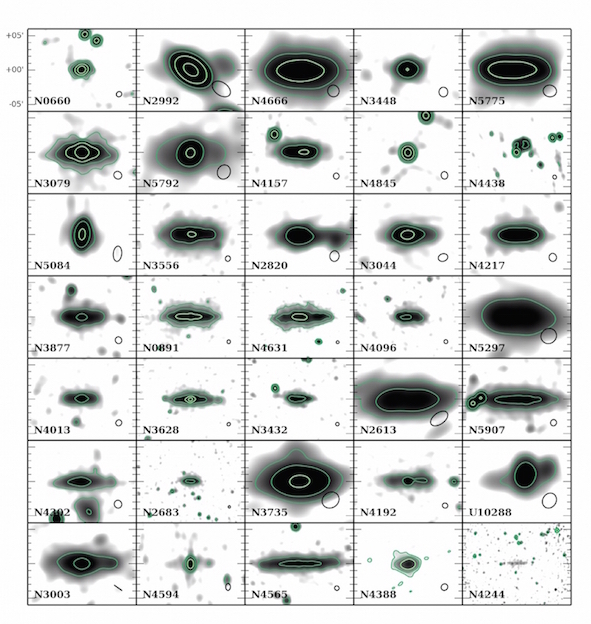 |
Figure 4. The CHANG-ES galaxies L-band data, rotated and scaled by size to a distance of 10 MPc, ordered by SFR density. Highest SFR density at top left, decreasing by row, left to right. Contours shown are at levels of 1, 5, 25 and 125 mJy/beam. 5' corresponds to 14.5 kpc at this scale. |
Fig. 4 reveals a wide range of physical sizes for the radio continuum emission in the various galaxies, both along the disk and into the halo. Some of the galaxies show a strong dominant central radio core (e.g. NGC 4594), others show a fairly large vertical radio extent (e.g. NGC 4666); some appear rather long and thin (e.g. NGC 4565), others show peculiar structure (e.g. NGC 4438 which has a radio lobe) and yet others are clearly influenced by nearby companions (e.g. NGC 4302).
The physical resolution, of course, varies for each galaxy and a detailed analysis must await a future paper. Nevertheless, it is fairly obvious that the first map (Fig. 4) is more of a comparison of radio continuum sizes than a revelation about correlations with SFR per unit area. We also note that there is sometimes an uncomfortable range of distances in the literature for some of the galaxies.
The second map (Fig. 5) is again ordered by SFR surface density. However, rather than scaling by distance, the galaxies are scaled by the 22 µm WISE WERGA major axis sizes (Table 6). The galaxy which has the largest angular size on the sky is NGC 4244 and the smallest is NGC 5084 (11.5' and 0.73' respectively). All galaxies were therefore scaled up to match the angular size of NGC 4244, again ensuring that the brightness was not changed and that the beams were also scaled. Such a map now essentially corrects for the various physical sizes of the galaxies (at 22 µm).
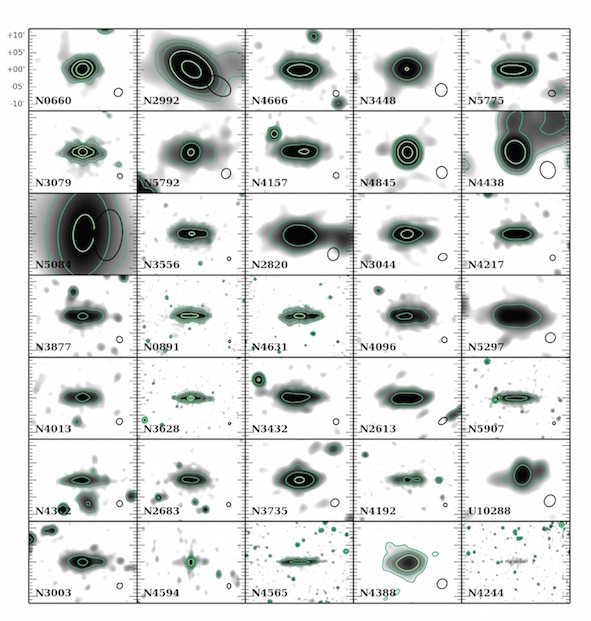 |
Figure 5. The CHANG-ES galaxies L-band data, rotated, and scaled to the 22 micron WISE-WERGA size of NGC 4244, ordered by SFR surface density. Highest SFR surface density at top left, decreasing by row, left to right. Contours shown are at levels of 1, 5, 25 and 125 mJy/beam. |
In this map, the radio emission still shows some size variation because the radio emission embedded within the galaxy might be compact or extended and, again, the spatial resolution varies. Nevertheless, a trend is now apparent, with galaxies at the top left (high SFR surface density) appearing more ‘boxy’, on average, than galaxies at the bottom right (low SFR surface density). For example, NGC 4244, which has the lowest SFR/unit area is clearly a very ‘flat’ galaxy with no radio halo evident, consistent with the H i distribution observed with a deep observation by Zschaechner et al. (2011). On the other hand, NGC 4666 which is unlikely to be contaminated by an AGN and has good spatial resolution, has an obvious halo.
Explorations of correlations with other parameters awaits a future paper.
14 https://science.nrao.edu/facilities/vla/docs/manuals/oss2014a/performance/fdscale Back.
15 The scaling described in this section was carried out using the Astronomical Image Processing System (AIPS) of NRAO. Back.