


A thick disk is seen as an excess of flux above and below the mid-plane of edge-on and highly inclined galaxies, typically at a few times the scale height of the thin disk component and with a larger exponential scale height than the thin disk which is dominant in the mid-plane regions. Thick disks in external galaxies were discovered and defined by Tsikoudi (1979) and Burstein (1979), and have since been found to be very common, in all kinds of galaxies (see, e.g., Dalcanton and Bernstein 2002, Yoachim and Dalcanton 2006, Comerón et al 2011a, Comerón et al 2011b). Our Milky Way has also been known for a long time to have a thick disk component (e.g., Yoshii 1982, Gilmore and Reid 1983), with stars in the thick disk having significantly lower metallicity than those in the thin component (Gilmore and Wyse 1985).
There is an ongoing debate on the issue of the definition of a thick disk. Early work on the thick disk in the Milky Way, and practically all work on extragalactic thick disks, basically fits stellar density distributions with thin and thick disk components, thus defining them geometrically. It is natural to assume that the stars forming part of the thus defined thick component have higher velocity dispersion, and possibly older ages and lower metallicity, than those in the thin disk. In our Milky Way, one can observe individual stars and one can thus define the thick disk chemically, for instance by measuring their α-element abundances relative to iron. Some of the interesting consequences of this are the confirmation by Bensby et al (2014) that the scale length of the thick disk is much shorter than that of the thin disk, or even the statement by Bovy et al (2012) that the Milky Way does not have a distinct thick disk at all but rather a continuous distribution of disk thicknesses (but see comments by Haywood et al 2013). This is an ongoing discussion which we note but will not review here. The interested reader may find more discussion and references in a recent conference discussion published by Kawata and Chiappini (2016).
Different formation mechanisms, which can be grouped into three main families, have been proposed for thick disks. All mechanisms directly link the properties of thick disks to the evolution of galaxies, and some indicate clear constraints on the formation of disks. The latter category includes the first broad class of models, in which the high velocity dispersion of the material forming the disk at high redshift led to the thick disk; the thin disk formed later from lower-dispersion material (e.g., Samland and Gerhard 2003, Brook et al 2004, Elmegreen and Elmegreen 2006, Bournaud et al 2009). The second class of models implies a secular origin for thick disks, by stipulating that they are caused by vertical heating and/or the radial migration of stars (e.g., Villumsen 1985, Schönrich and Binney 2009; see also the review by Debattista et al, this volume). In the third class of models the thick disk arises from interactions with satellite galaxies, through the accretion of stars (e.g., Quinn et al 1993) or through dynamical heating (e.g., Abadi et al 2003). No consensus exists as yet in the literature as to which model is the most adequate, and it is likely that all play some role in the formation of thick disks.
Focussing now on the detection and characterisation of extragalactic thick disks, there are two main techniques in use: star counts and direct imaging. The former can be done only in the nearest of external galaxies and only with the HST, the latter, in principle, across much larger samples (see below). Older work on resolved stars with HST includes that by Mould 2005, Tikhonov and Galazutdinova 2005, Seth et al 2005, and Rejkuba et al 2009, who use resolved red giant branch (RGB) stars to characterize the thick disk component in one or a handful of galaxies. Recent HST work includes that by Streich et al (2016) who used images from the GHOSTS survey to note the absence of a separate thick disk component for three of their survey galaxies (although their choice of galaxies was not optimal: they are of low mass, so dust lanes are weak or absent and hence the inclination cannot be established well—an important point as thick disks are optimally studied in edge-on galaxies).
Among the most comprehensive studies of samples of external galaxies is that by Yoachim and Dalcanton (2006) who used mainly R-band imaging of 34 late-type edge-on disk galaxies to measure the main structural parameters of the thin and thick disk components by fitting one-dimensional analytic expressions based on the generalized function sech2/n. Although such functions give decent fits to profiles, they are essentially ad hoc and, in the case of superposed fits of both a thin and a thick disk, ignore the gravitational interaction between the two disk components and therefore are not well justified physically.
To remedy this, Comerón et al (2011a) integrate the equations of equilibrium for a set of gravitationally coupled isothermal stellar and gas disks to derive the parameters of the thin and thick disk components, in particular their relative masses. These authors used deep imaging at 3.6 µm from the Spitzer Survey of Stellar Structure in Galaxies (S4G; Sheth et al 2010), which have the advantage of being essentially unaffected by dust—an important consideration when studying edge-on galaxies. Fitting one-dimensional luminosity profiles obtained from the images of 46 edge-on and highly inclined galaxies, after a careful masking and background-modelling and -subtraction effort, Comerón et al (2011a) found that thick disks are not only ubiquitous, but also significantly more massive than previously reported. Typically, thick and thin disks have comparable masses (Fig. 4), which favours an in situ origin for the thick disk component, with possibly significant additional amounts of stars from satellites that were accreted after the formation of the galaxy, or from secular heating of the thin disk. Because of the different mass-to-light ratios in thin and thick disks, the reported higher mass fractions in the thick component lead to higher overall disk masses, and thus a reduced need for dark matter.
 |
Figure 4. Ratio of the mass of the thick to that of the thin disk, MT / Mt, as function of circular velocity vc for a sample of edge-on galaxies expanded from that of Comerón et al (2012). The new analysis underlying these data incorporates PSF modelling and correction. A value of unity indicates equal thick and thin disk masses. Figure reproduced with permission from S. Comerón et al (in prep.) |
In a later paper, Comerón et al (2012) confirmed this basic result with a somewhat larger sample of 70 edge-on galaxies, while Comerón et al (2014) used an analysis of the thin and thick disk components as well as of the central mass concentrations (CMCs; “bulges”) to conclude that the ratio of the mass of the dynamically hot components (thick disk and CMC) and that of the cold components (thin and gas disks) is constant and does not depend on the mass of the galaxy. This suggests that both the thick disk and the CMC were formed early on, in a short phase of intense star formation activity, and in a turbulent gas disk. The other components were formed later, in a slower phase of lower star formation intensity. Recent work (S. Comerón et al, in prep.) shows that PSF effects in the S4G imaging are small enough not to influence any of these main conclusions.
Future work will focus on a number of different areas. Firstly, building larger samples of galaxies with accurately determined thick disk properties, both locally and at higher redshift. The deepest HST imaging (e.g., of the Hubble ultra-deep fields) can in principle be used for the latter, while the LSST (see Sect. 5) should provide the deep imaging of huge samples of nearby galaxies. Secondly, obtaining detailed information on the kinematics and stellar populations of the thick disks. This is starting to be done now with large telescopes. For instance, Comerón et al (2015) used observations with the VIMOS instrument on ESO's Very Large Telescope (VLT) to deduce from its kinematics and stellar populations that the thick disk in the galaxy ESO 533-4 formed in a relatively short event, Comerón et al (2016) used MUSE on the VLT to conclude that the thick disk in the S0 galaxy ESO 243-49 formed early on in the history of the galaxy, and before the star formation in the galaxy was quenched, while Kasparova et al (2016) and Guérou et al (2016) provide further evidence that the formation mechanisms of thick disks in galaxies are diverse. Deep spectroscopy with large telescopes, as well as careful colour measurements from LSST imaging, will no doubt bring further progress here, and thus shine light on the formation of disk galaxies.
The relatively sharp edges of edge-on stellar disks, referred to as truncations, were first noted by van der Kruit (1979). Such truncations, typically occurring at radii of around four or five times the exponential scale-length of the inner disk and with scale lengths of less than 1 kpc, appear to be very common, with about three out of four thin discs truncated (Comerón et al 2012, see the review by van der Kruit and Freeman 2011 for further details).
Truncations are important as they are potential key indicators of the formation and early evolution processes that have shaped disk galaxies, as reviewed in detail by van der Kruit and Freeman (2011), in particular in their Sect. 3.8. For instance, as the truncation corresponds to the maximum in the distribution of specific angular momentum across the disk, it may indicate directly what that distribution was in the proto-galaxy, in the case of conservation of angular momentum. Re-distribution of material in the disk, as reviewed by Debattista et al (this volume), may have occurred, leading to the current distribution of angular momentum being unrelated to that of the material that formed the disk. In addition, as reviewed by Elmegreen and Hunter (this volume), disk breaks and truncations are intimately related to the past and present star formation processes in disks.
While it is thus important to characterize truncations, only in edge-on galaxies are they bright enough to have been observed routinely for the past decades, first on the basis of photographic imaging and later using CCDs. Imaging them in face-on or moderately inclined galaxies has so far proven mostly elusive. Not only will truncations occur at much fainter levels there because of reduced line-of-sight integration through the disk, they can also be masked by the lopsided nature of spiral galaxies (e.g., Zaritsky et al 2013), or confused by the onset of stellar haloes (Martín-Navarro et al 2014). In addition, “disk” breaks at relatively high surface brightnesses and occuring at ∼ 8 ± 1 kpc in edge-on galaxies have been confused in the literature with truncations, at ∼ 14 ± 2 kpc (Martín-Navarro et al 2012). For instance, the features labelled as truncations by Pohlen and Trujillo (2006) most probably are disk breaks rather than the face-on counterparts of the truncations observed in edge-on galaxies.
Using some of the deepest imaging available for samples of nearby galaxies, the SDSS Stripe 82 dataset (see Fliri and Trujillo 2016 and Sect. 3.1), Peters et al (2017) have recently attempted to find the elusive truncations in a sample of 22 face-on to moderately inclined galaxies. They used the new data products from Fliri and Trujillo (2016) and added the g′, r′ and i′ images to reach extra depth. They selected their galaxies to be undisturbed, and with well-behaved image backgrounds, and were able to extract surface photometry down to 29−30 r′-mag arcsec−2 after performing careful but aggressive masking and modelling of residual background gradients (see Fig. 1 for an example). Peters et al (2017) then used and compared a variety of different analysis and extraction methods to optimize the detection and characterisation of truncations in their sample galaxies.
Figure 5 illustrates many of the results of Peters et al (2017). Firstly, disk breaks at relatively high surface brightness were found in the radial profiles of most galaxies (blue dots in the figure), at levels of typically 22−24 r′-mag arcsec−2. Their radius scales with galaxy radius. Secondly, truncations were indeed identified in three of these moderately inclined galaxies, at surface brightness levels of around 28 r′-mag arcsec−2. Thirdly, in most galaxies a flattening of the radial profile is seen, interpreted as the onset of the stellar halo 2, and starting to dominate the profiles at 28 ± 1 r′-mag arcsec−2. Fourthly, not only do the radii of the onsets of the truncation and the halo components scale with galaxy size, for some reason they do that in the same manner, so that truncation and halo points (red pentagons and green triangles, respectively, in Fig. 5) line up on the same relation. This intringuing relation deserves further attention with other independent surveys, as these features are barely above the surface brightness limit of the Stripe82.
 |
Figure 5. Feature size R as a function of galaxy size, indicated by R25, for the moderately inclined to face-on galaxies in the sample of Peters et al (2017). Red pentagons represent truncations, green triangles the onset of the stellar halo, and blue circles disk breaks which occur further inside the disk. Reproduced with permission from Peters et al (2017). |
A further very interesting observation from Peters et al (2017) is that truncations are only observed in those galaxies from which the halo component is either absent or fainter than usual, although no indications were found from galaxy or feature parameters as to why the halo might be faint or absent. Of the seven galaxies with faint or absent haloes, three were found to host truncations. This is not out of line with the statistical result of Kregel et al (2002) that at least 20 of their 34 edge-on galaxies were truncated. More detailed study of larger samples of galaxies should shed further light on these important issues, and future developments are promising in this respect (see Sect. 5).
Tidal streams are the imprints of the ongoing merging activity of galaxies. They are present around a significant fraction of galaxies, showing different shapes, brightnesses and extensions depending on their progenitor's mass and orbit. The structural (and kinematical) properties of tidal streams can be used to infer information about the dark matter haloes in which the host galaxies are embedded (Bullock and Johnston 2005). These authors conclude that the vast majority of stream features have very low surface brightness (µV ≳ 28.5 mag arcsec−2). More precisely, cosmological simulations predict around one detectable stream per galaxy if the observations reach a depth of ∼ 30 mag arcsec−2 (e.g., Bullock and Johnston 2005, Johnston et al 2008, Cooper et al 2010). This makes the use of very deep surveys mandatory if one wants to have a complete census of past merging activity.
The detailed analysis of our Milky Way and the Andromeda galaxy M31 (using the star count technique) has revealed a plethora of substructure in these objects. Due to the vicinity of these galaxies, the star count technique can reveal features which have surface brightnesses equivalent to µV ∼ 32 mag arcsec−2 (e.g., Ibata et al 2001, Majewski et al 2003, Belokurov et al 2006, Bell et al 2008, McConnachie et al 2009). These levels are extremely challenging to reach using integrated photometry (the only case published to date is that of the galaxy explored in 1062016Trujillo and Fliri). The need, however, for conducting an extensive survey exploring the variety of features around galaxies like the Milky Way is pressing. In fact, according to theory, a large galaxy-to-galaxy variation is expected due to the intrinsic stochasticity of the merger phenomenon. For this reason, to have a proper comparison with theory it is urgent to have a large survey exploring hundreds of galaxies beyond the Local Group. This is only achievable using the integrated photometry technique. The star count technique becomes unfeasible (with current telescopes) beyond ∼ 16 Mpc (Zackrisson et al 2012).
The first attempt to systematize the search for streams in galaxies beyond the Local Group has been made by Martínez-Delgado et al (2010). These authors use modest (≲1 m) aperture telescopes using integration times ∼ 10-20 h, allowing them to reach µg ∼ 28.5 mag/arcsec2. They have found a large variety of tidal stream morphologies in eight nearby galaxies: large arc-like features, giant “umbrellas”, shells, plumes, spiral-like patterns, etc. These morphologies are similar, at least qualitatively, to those expected in cosmological simulations. However, the galaxies explored in Martínez-Delgado et al (2010) are not represenative of the general galaxy population as they were preselected to have bright structure surrounding them. In this sense, despite the effort of these authors, the comparison of theory with observations remains currently in its infancy. This is because a large survey, probing hundreds of randomly selected galaxies, is still missing.
Tidal streams and stellar haloes around galaxies are intimately connected. In fact, in observations with enough resolution and signal-to-noise stellar haloes should appear as a combination of many different merger events (and consequently, the sum of many tidal streams). Stellar haloes also have a diffuse component which corresponds to those accretion events that happened very early on in a galaxy's evolution. Whereas bright tidal streams inform us about the ongoing or recent merging activity of a galaxy, stellar haloes give us information about the past accretion story of galaxies.
In contrast with numerical simulations, where the characterization of the stellar halo is relatively simple, there is no agreement in the literature on how to quantify the properties of stellar haloes using images of galaxies alone. Simulations (e.g., Cooper et al 2010, Font et al 2011, Tissera et al 2014, Pillepich et al 2014) show unequivocally that the contribution of accreted stars rises towards the centre of galaxies. In fact, in numerical simulations the accreted material follows surface mass distributions that can be modelled well with Sérsic (with Sérsic indexes n ≲ 3) or power-law profiles (with logarithmic slope ∼ 3.5) for the 3D density profiles. Accreted stars are the main contributors to the stellar mass surface distribution of galaxies in their outer regions, however, towards the inner zones they contribute much less in comparison with the stars that have formed in situ (a factor of ∼ 100 in projected density; Cooper et al 2013).
The observational characterization of stellar halo profiles has followed different approaches. Several authors fit the outer (stellar halo-dominated) surface brightness region with some analytical profile, for instance, exponential (e.g., Irwin et al 2005, Ibata et al 2007, Trujillo and Fliri 2016) or power-law (with logarithmic slopes ∼ 2.5; e.g., Tanaka et al 2010, Courteau et al 2011, Gilbert et al 2012). This approach has the disadvantage of assuming a particular shape of the stellar halo towards the inner region of galaxies, motivated by numerical simulations. This shape is derived by extrapolating the fit to the outer region towards the inner area. There is no way of eliminating this assumption observationally with integrated photometry alone, because in the central part of the galaxy the light is dominated by the bulge and disk. Other authors avoid making any assumption about the inner shape of the stellar halo profile and measure the properties of the stellar halo only in the outer regions where the halo is the dominant contribution. For instance, Buitrago et al (2016), for elliptical galaxies, use the radial region 10 < R(kpc) < 50 whereas Merritt et al (2016) use R(kpc) > 5 Rh (with Rh the half-mass radius) for spiral galaxies. This approach has the disadvantage of neglecting the (dominant) contribution of the stellar light of the halo in the innermost region of the galaxy. Any of the two above approaches to measure the relevance of the stellar halo can be followed if a proper comparison (i.e., following the same scheme) is conducted with the numerically simulated galaxies as well. In the literature it is common to find a comparison of the amount of stellar mass in the stellar halo with the total stellar mass of the galaxy. This relation is then compared with numerical predictions (see, e.g., Fig. 6). Observers directly measure neither the light contribution from the stellar haloes nor the stellar mass. To transform from light to stellar mass it is necessary to estimate a stellar mass to light ratio. This can be done using photometric information from several filters (when available).
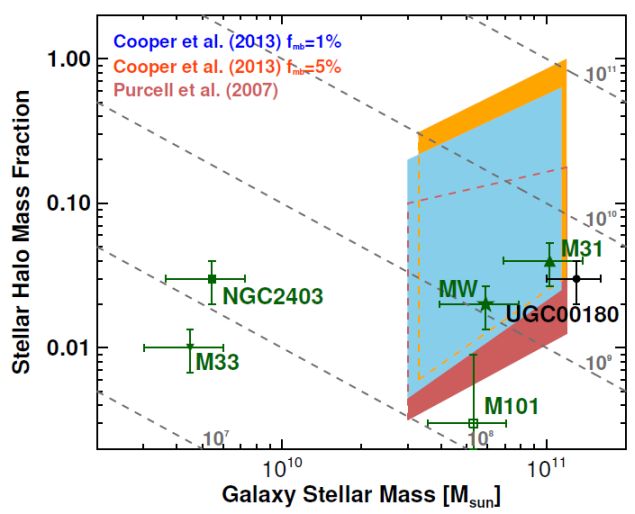 |
Figure 6. Stellar halo mass fraction versus total galaxy stellar mass, illustrating the location of some nearby galaxies in this plane. In addition, the prediction from several numerical models are overplotted (Purcell et al 2007, Cooper et al 2013). The dashed lines are the locations of stellar haloes with fixed stellar mass (107, 108, 109, 1010 and 1011 M⊙). Figure from Trujillo and Fliri (2016), reproduced by permission of the AAS. |
The fraction of mass in the stellar haloes of disk (Milky Way-like) galaxies is around 1%. However, there are notable exceptions like M101, which does not show evidence for a stellar halo (van Dokkum et al 2014) even when using deep imaging. Observed stellar haloes are, in general, less massive than expected from theory. Nonetheless, the number of observed galaxies is still too limited to consider this as a serious concern.
Measuring the amount of stellar mass in the stellar halo is a strong test to probe the predictions from the Λ-Cold Dark Matter (ΛCDM) model in the context of galaxy formation. Ultimately, the amount of stars in this component of the galaxy informs us about the merging activity along the full history of the galaxy. Consequently, if the observed stellar haloes are less massive than the theoretical expectations this might indicate that the number of accretion events was less than presumed. If this were in fact the case, we could be witnessing a problem for the ΛCDM scheme as relevant as the missing satellite problem (see Sect. 4.5).
4.4.1. PSF Effects on Imaging the Outermost Regions of Galaxies
As discussed in Sect. 2.5, one of the most important sources of light contamination in deep images is the contribution of scattered light from nearby sources surrounding the target galaxy. However, the galaxy itself is usually one of the most important sources of light contamination in the vicinity of the object. This is easy to understand. The surface brightness distribution of the galaxy is convolved with the PSF of the image. That means that a substantial amount of light coming from the central parts of the galaxy is distributed into its outermost region. Sandin (2014, 2015) has nicely illustrated this phenomenon, showing that the scattered light from the object (if not accounted for) can be wrongly interpreted as a bright stellar halo or a thick disk. This was also explored by de Jong (2008). Depending on the shape of the surface brightness distribution of the galaxy, the effect of its own scattered light can be more or less relevant in its outer region. Edge-on disks are normally most severely affected by this effect, whereas face-on galaxies without breaks or truncations are barely affected. As a general rule, the effect will be stronger in those cases where the light distribution is sharper. In Fig. 7, we show an example of the effect of the PSF on the light distribution of a spiral galaxy.
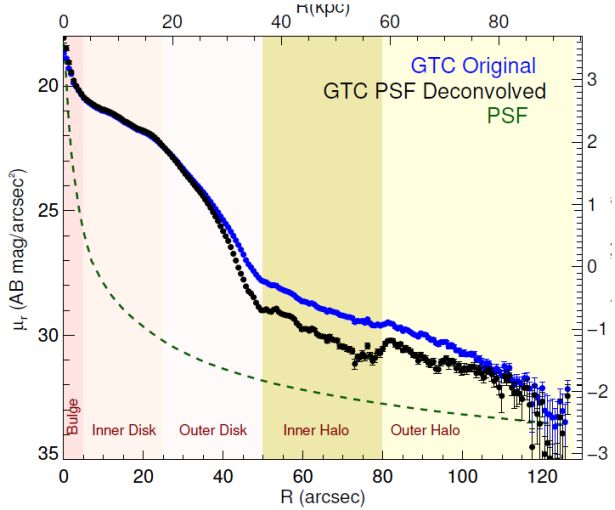 |
Figure 7. The effect of the PSF on the surface brightness profile of the spiral galaxy UGC 00180. The observed profile (upper one) is shown using blue dots. The profile corrected for the effect of the PSF (lower profile) is illustrated with black dots. The green dashed line is the surface brightness profile of the PSF of the image. The different parts of the galaxy are indicated with labels. Figure from Trujillo and Fliri (2016), reproduced by permission of the AAS. |
As Fig. 7 illustrates, the effect of the PSF on the outer regions of the galaxy is dramatic. For this particular galaxy, the surface brightness profiles start to deviate at around 26 mag arcsec−2. At µr ∼ 26 mag arcsec−2, the effect is so important that the surface brightness profiles (affected by the PSF and corrected) are different by about 1 mag. This means that in the outer regions the scattered light can be as much as three times brighter than the intrinsic light of the stellar halo. For this reason, it is absolutely necessary to model the effect of the PSF on the galaxy itself if one wants to explore the faintest regions of the galaxies.
There are two different approaches to handle the effect of the PSF on the surface brightness distribution of the galaxies. The first one is to apply a deconvolution method directly on the images. This has the advantage that it only requires an exquisitely characterized PSF of the image. However, its main disadvantage is that in the regions where the surface brightness is closest to the noise the result is quite uncertain. The second approach is to model the intrinsic light distribution of the galaxy and convolve this with the PSF. The convolved model of the galaxy is then fitted to the observed light distribution until a good fit to the data is reached. Once this is achieved, a new image of the object (using the deconvolved model of the galaxy) is created, adding back the residuals of the fit. This is illustrated in Fig. 8.
 |
Figure 8. The dramatic effect of the PSF on the surface brightness distribution of the spiral galaxy UGC 00180. Different surface brightness isophotes are indicated with solid and dashed lines. After accounting for the effect of the PSF the amount of light in the outer regions decreases strongly. Figure from Trujillo and Fliri 2016, reproduced by permission of the AAS. |
Figure 8 shows that studies of both thick disks and outer stellar haloes are strongly affected by the PSF. Any deep imaging study of these components needs to account for this effect, otherwise both the stellar haloes and the thick disks that will be inferred will result significantly brighter than what they really are.
Satellites are probably one of the most important pieces to connect the realm of obseved galaxies with cosmological modelling. In fact, counting the number of satellites and exploring their properties has become one of the most important tests to explore the predictions of the ΛCDM model on small (i.e., galactic) scales. The analysis of Local Group galaxies has revealed a number of problems related with satellite galaxies. These can be summarized as follows:
There are a number of solutions to the above cosmological problems at galactic scales. One possibility is that the main constituent of dark matter would not be a heavy (i.e., cold) particle but instead a lighter (i.e., warm) candidate (with a mass of around a keV). This hypothesis has been explored in many papers as it is able to suppress many of the dark matter haloes which should form dwarf galaxies (e.g., Moore et al 1999, Bode et al 2001, Avila-Reese et al 2001). This alleviates the problem of the missing satellites. This solution is not free of other problems, however, mainly the current constraint on the mass of the warm dark matter candidate imposed by the study of the Lyman α forest (i.e., ≳ 4 keV; Baur et al 2016). This mass is large enough to mimic most of the properties of the ΛCDM scenario (including the production of a large number of dark matter subhaloes). Consequently, warm dark matter particle candidates with such minimum mass would not be of great help. Another alternative is to consider the baryon physics in detail when creating realistic cosmological simulations. It is worth stressing that the above problems arise when comparing simulations of dark matter alone (i.e., devoid of gas and stars) with the frequency and properties of satellites in the Local Group. However, some authors, like Navarro et al (1996) or Read and Gilmore (2005) have pointed out the interplay between baryons and dark matter. In fact, they have suggested that the dark matter could be heated by impulsive gas mass loss driven by supernova explosions. If so, this could help to reconcile the cosmological simulations with the observations.
The above discrepancies between theory and observations are based on the comparison of the properties of the satellites galaxies of two massive disks, i.e., those of our own Galaxy and Andromeda. Consequently, a natural question arises: is our Local Group anomalous in producing a low number of satellites? To address this question in detail, we need to characterize the satellite population of many galaxies like ours beyond the Local Group. This idea has been pursued by several authors (see, e.g., Liu et al 2011, Ruiz et al 2015). Unfortunately, their analyses have only explored the population of the most massive satellites (i.e., down to masses ∼ 108 − 109 M⊙). To test the discrepancies between the cosmological models and the observations it is necessary to go at least two orders of magnitudes fainter (i.e., down to 106 M⊙). This is where new ultra-deep imaging surveys can play a definitive role (see, e.g., Javanmardi et al 2016). To explore satellites with masses around 106 M⊙ within a sphere of radius ∼ 100 Mpc, we need to be able to reach a depth like the one achieved by Stripe 82. If we want to go further and explore a population of satellites with masses of a few times 104 M⊙ (which is currently the mass limit of detected satellites in Andromeda) we would need a survey with the depth reached by the current deepest dataset (i.e., the one of Trujillo and Fliri 2016). A survey with such characteristics could be obtained at the end of the LSST programme (Ivezic et al 2008; see Sect. 5).
2 Peters et al (2017) perform a careful PSF modelling to ensure that the observed haloes are not artifacts caused by the PSF. Back.