

5.1. Radial Gradients
Because of their, on average, elevated metallicities, studies of HII region abundances in spiral galaxies are dominated by empirical abundances (cf. Section 2.2.2). For nine of the twelve HII regions in our NGC 2403 sample, we have detected at least one emission line ratio that is sensitive to electron temperature, (Te). We were able to measure three of the Te-diagnostic ratios discussed in Section 2.2.1:
(1) the commonly used [O III] 
 4959,5007 /
 4363
ratio. This ratio is easiest to measure at lower abundances
where the [O III] lines are strong.
(2) [O II]  3727 /
 7325: This line ratio is often
relatively easy to measure in low-excitation HII regions, because
of the weaker dependence on electron temperature than the [O III]
ratio. However, the long wavelength baseline makes the ratio much more
sensitive to reddening.
(3) [S III] 
 9069,9532 /
 6312:
A systematic uncertainty arises because
the
 9069, 9532 lines can suffer from
telluric absorption. An
evaluation of the degree to which these lines are affected can be
made from the
  9532 /
 9069 intensity ratio, which
has a theoretical value of 2.44 (based on the ratio of the Einstein
A-values). For our purposes, we evaluate the [S III] temperatures
by revising either the
  9069
or the
  9532 upward
so that the
  9532 /
 9069 ratio equals 2.44.
Figure 13 shows a plot of the various measured values of Te vs. galactocentric radius in NGC 2403. The plot clearly shows that there is a radial gradient in electron temperature across the galaxy, an indication of a corresponding gradient in the composition of the ionized gas. There is evidence that the [O II] temperatures are systematically higher than the [O III] temperatures; in agreement with photoionization model predictions of the temperature of cool, metal-rich HII regions (e.g., Stasinska 1990, Garnett 1992).

|
Figure 13. Electron temperature measurements vs. galactocentric radius for HII regions in NGC 2403. The filled squares are temperatures measured from the [O III] lines; open circles from [O II] measurements, and crosses from [S III] measurements. (From Garnett et al. 1997b). |
Figure 14 shows O/H as a function of radius in NGC 2403 for twelve H II regions. We have confirmed that there is a gradient in O/H across NGC 2403 with a slope of -0.1 dex/kpc, similar to gradients found in spiral galaxies of similar de Vaucouleurs T type (VCE; ZKH). The steep slope is consistent with the lack of a bar in NGC 2403 (cf. Martin & Roy 1994). An important test of the gradient would be an improved measurement of the outermost point, H109, at 9.4 kpc (R/R0 = 1.18) from the nucleus. The forbidden line strengths suggest a relatively high O/H based on the Edmunds & Pagel (1984) calibration, but they are also in the regime where the calibration is double-valued. A good measurement of O/H in H109 would resolve the ambiguity in the slope of the composition gradient, and provide important information on the conditions in the extreme outer disk of NGC 2403. The value of accurate abundance determinations in extreme outer disk HII regions was demonstrated by Garnett & Shields (1987), Garnett, Odewahn, & Skillman (1992) and Kennicutt & Garnett (1996).

|
Figure 14. Log O/H vs. radius for NGC 2403 HII regions. Filled circles show the regions observed in this study, open circles represent measurements from Fierro et al. (1986), and crosses data from McCall et al. (1985). A weighted least-squares fit yields a gradient of -0.102 ± 0.009 dex/kpc. (From Garnett et al. 1997b). |
Let us now compare the abundances in NGC 2403 with the simple, closed box model of chemical evolution. We assume that a ring at fixed galactocentric radius of a galaxy can be described by the closed box model, and compute a model for O/H as a function of gas fraction which matches the observations.
The gas fraction as a function of radius was determined from HI 21 cm measurements (Wevers et al. 1986) and H2 determinations from CO measurements (Thornley & Wilson 1995). There is a well known uncertainty in converting CO observations to H2 distributions (cf. Israel 1988a, b; Maloney & Black 1988), but the inner part of NGC 2403 has metallicities close to the solar value, so the CO-to-H2 conversion may be expected to be similar to solar neighborhood values.
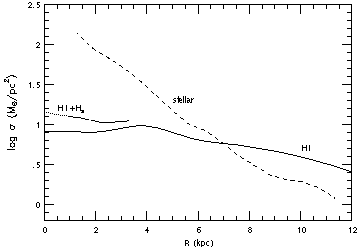
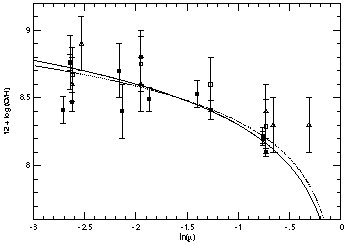
Stellar surface mass densities for the disk were determined from the radial disk surface brightness distribution (Wevers et al. 1986). The run of disk mass surface density as a function of radius for the various components is displayed in Figure 15 (top). Models were computed with various values for the oxygen yield, y(O), and the best model, with y(O) = 0.0024 ± 0.0001 (corresponding to y = 0.0047 if O comprises 45% of Z by mass), is shown as the solid curve in Figure 15 (bottom).

|

|
Figure 15. Top: Radial variations of surface mass densities of HI, H2, and stars in NGC 2403. Bottom: O/H vs. ln(gas fraction) in NGC 2403. Solid line is the simple closed box chemical evolution model with oxygen yield by mass y(O) = 0.0022; dotted line is Clayton's parameterization of models with infall of metal-free gas with y(O) = 0.0030. (From Garnett et al. 1997b) |
As noted previously by Garnett & Shields (1987) for M81, the simple model provides a surprisingly good fit to the observations. However, Twarog (1985) and Clayton (1987) have pointed out that the Z-ln µ diagram distinguishes poorly between the simple model and models incorporating infall. This is illustrated in Figure 15 by the dotted curve, which is a model based on the alternate relation
from Clayton (1987),
who presented it as a useful approximation to a
number of models with infall of metal-free gas that decays exponentially
with time. The dotted curve plotted in
Figure 15 has y(O) = 0.0030. It
is clear that this model also adequately explains the data, ignoring
the outermost point (H109 from MRS).
The yield derived for this model
is still significantly smaller than that obtained for the solar
neighborhood, but this should not be taken to be a reliable estimate
for the yield in NGC 2403. From this exercise, we do not see evidence
in NGC 2403 for a
systematic variation in effective yield with metallicity.
So, why do spiral galaxies have gradients? That most spiral galaxies
have chemical gradients has been known for quite some time (e.g.,
Pagel & Edmunds 1981).
Unfortunately, theorists have thought of
many different ways to create abundance gradients. These include:
radial variations in the star formation rate (the basis for the
simple model fit above, e.g.,
Phillipps & Edmunds
1991);
inflow, radial flows, or a combination (e.g.,
Mayor & Vigroux 1981;
Lacey & Fall 1985;
Clarke 1989;
Sommer-Larson &
Yoshii 1989,
1990;
Götz &
Köppen 1992;
Zaritsky 1992),
or IMF variations
(e.g., Güsten &
Mezger 1982).
With so many different theories,
and with so few features in the gradients, it may be some time
before we have a good understanding of the origins of the gradients
in spirals. I take hope in two different facts. First, the study
by Martin & Roy (1994)
represents a true step forward in our
understanding of spirals - they were able to show that the
shallower gradients in barred spiral galaxies correlated well
with the strength of the bar. Secondly, the sampling in spiral
galaxies is reaching the point that questions concerning the
homogeneity of the abundances in radial zones (e.g.,
Kennicutt & Garnett
1996)
and the degree to which the gradient is well described as an exponential (e.g.,
Scowen et al. 1992;
Zaritsky 1992)
can be answered. Optimistically, as these questions
are answered, fundamental constraints on mixing and the role of
galaxian dynamics may produce a true understanding of the
gradients in spirals.
Figure 16. (a) Oxygen abundance gradient
per unit physical length (dex/kpc)
versus galaxy luminosity. A good correlation is seen. (b) The correlation
in (a) disappears when the gradient per unit disk scale length is plotted
instead. (From
Garnett et al. 1997b).
To support my optimistic outlook, I
return to the study of NGC 2403 by
Garnett et al. (1997b).
In that study, Don assembled a sample of spiral galaxies for which
he felt that the gradients were well determined and compared their
gradients with their luminosities. The results are shown in
Figure 16.
There is quite a marked correlation between the slope of the abundance
gradient G (in dex/kpc) and galaxy luminosity
(Figure 16a).
This correlation arises because bigger galaxies have longer
exponential scale lengths. Figure 16b
illustrates this by showing the
abundance gradients in dex per disk scale length (GS) as a function
of MB. GS shows no correlation with
luminosity. Indeed, the GS
values appear to occupy a relatively narrow range, with one outlying point.
It would be interesting to determine whether the scatter in
GS is greater than observational scatter (assuming a 25%
uncertainty seems reasonable - ZKH obtained uncertainties
ranging between 10% and 100% for gradient slopes).
Figure 16b suggests that non-barred spirals are
homologous in their chemical properties, with the global metallicity
scaling as the galaxy mass. It also indicates that the gas abundances
are tied to the local mass surface density in the disk.

