


There is now a substantial body of observations that support directly and indirectly the relativistic hot Big Bang model for the expanding Universe. Equally important, there are no data that are inconsistent. This is no mean feat: The observations are sufficiently constraining that there is no alternative to the hot Big Bang consistent with all the data at hand. Reports in the popular press of the death of the Big Bang usually confuse detailed aspects of the theory that are still in a state of flux, such as models of dark matter or scenarios for large-scale structure formation, with the basic framework itself. There are indeed many open problems in cosmology, such as the the age, size, and curvature of the Universe, the nature of the dark matter, and details of how large-scale structures form and how galaxies evolve - these issues are being addressed by a number of current observations. But the evidence that our Universe expanded from a dense hot phase roughly 13 billion years ago is now incontrovertible (see, e.g., Peebles et al. 1991).
When studied with modern optical telescopes, the sky
is dominated by distant faint blue galaxies.
To 30th magnitude per square arcsecond surface brightness (4 x
10-18 erg sec-1 cm-2
arcsec-2 in 100 nm bandwidth at 450 nm wavelength,
or about five photons per minute per galaxy collected with a 4-meter mirror)
there are about 50 billion galaxies over the sky.
On scales less than around 100 Mpc galaxies
are not distributed uniformly, but rather cluster in a hierarchical
fashion. The correlation length for bright galaxies is
8h-1 Mpc (at this distance from a galaxy the probability of
finding another galaxy is twice the average). (1 Mpc = 3.09 x
1024 cm  3 million
light years, and h =
H0 / 100 km s-1 Mpc-1 is
the dimensionless Hubble constant.)
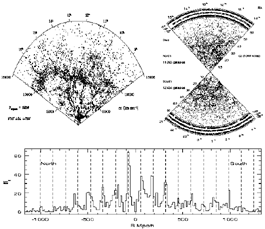
About 10 percent of galaxies are found in clusters of galaxies, the largest of which contain thousands of galaxies. Like galaxies, clusters are gravitationally bound and no longer expanding. Fritz Zwicky was among the first to study clusters, and George Abell created the first systematic catalogue of clusters of galaxies in 1958; since then, some four thousand clusters have been identified (most discovered by optical images, but a significant number by the x-rays emitted by the hot intracluster gas). Larger entities called superclusters, are just now ceasing to expand and consist of several clusters. Our own supercluster was first identified in 1937 by Holmberg, and characterized by de Vaucouleurs in 1953. Other features in the distribution of galaxies in 3-dimensional space have also been identified: regions devoid of bright galaxies of size roughly 30 h-1 Mpc (simply called voids) and great walls of galaxies which stretch across a substantial fraction of the sky and appear to be separated by about 100 h-1 Mpc. Figure 1 is a three panel summary of our knowledge of the large-scale structure of the Universe.
|
Figure 1. Large-scale structure in the
Universe as traced by bright galaxies: (upper left)
The Great Wall, identified by
Geller and Huchra
(1989)
[updated by
E. Falco]. This coherent object stretches across most of the sky; walls
of galaxies are the largest known structures (see
Oort 1983).
We are at the apex of the wedge, galaxies are placed at their ``Hubble
distances'', d = H0-1 Mu |
In the late 1920's Hubble established that the spectra of galaxies at greater distances were systematically shifted to longer wavelengths. The change in wavelength of a spectral line is expressed as the ``redshift'' of the observed feature,
Interpreting the redshift as a Doppler velocity, Hubble's
relationship can be written
The factor H0, now called the Hubble constant, is the
expansion rate at
the present epoch. Hubble's measurements of H0 began
at 550 km s-1 Mpc-1; a number of systematic errors
were identified, and by the 1960s H0 had dropped to
100 km s-1 Mpc-1.
Over the last two decades controversy surrounded H0, with
measurements clustered around 50 km s-1 Mpc-1 and 90 km
s-1 Mpc-1.
In the past two years or so, much progress has been made because
of the calibration of standard candles by the Hubble Space Telescope
(see e.g.,
Filippenko and Riess
1998;
Madore et al. 1998),
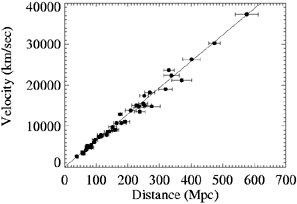
and there is now a general consensus that H0 = (67
± 10) km s-1 Mpc-1
(where ± 10 km s-1 Mpc-1 includes both
statistical and systematic error; see Fig. 2).
The inverse of the Hubble constant - the Hubble time -
sets a timescale for the age of the Universe:
H0-1 = (15 ± 2) Gyr.
Figure 2. Hubble diagram based upon
distances to supernovae
of type 1a (SNe1a). Note the linearity; the slope, or Hubble constant,
H0 = 64 km s-1 Mpc-1 (Courtesy,
A. Riess; see
Filippenko & Riess
1998).
By now, through observations of a variety of phenomena from optical galaxies
to radio galaxies, the cosmological interpretation of redshift is very well
established. Two recent interesting observations provide further
evidence: numerous examples of high-redshift objects being
gravitationally lensed by low redshift objects near the line of sight;
and the fading of supernovae of type Ia, whose light curves
are powered by the radioactive decay of Ni56, at high redshift
exhibiting time dilation by the predicted factor of 1 + z
(Leibundgut et
al. 1996).
An important consistency test of the standard cosmology is the
congruence of the Hubble time with other independent determinations
of the age of the Universe. (The product of the Hubble constant
and the time back to the big bang, H0
t0, is expected to be
between 2/3 and 1, depending upon the density of matter in the Universe;
see Fig. 3.) Since the discovery of the
expansion, there have
been occasions when the product H0t0
far exceeded unity,
indicating an inconsistency. Both H0 and
t0 measurements have been
plagued by systematic errors. Slowly, the situation has
improved, and at present there is consistency within the uncertainties.
Chaboyer et al. (1998)
date the oldest globular stars at 11.5 ± 1.3 Gyr;
to obtain an estimate of the age of the Universe,
another 1-2 Gyr must be added to account for the time to
the formation of the oldest globular clusters. Age estimates
based upon abundance ratios of radioactive isotopes produced
in stellar explosions, while dependent upon the time history of
heavy-element nucleosynthesis in our galaxy, provide a
lower limit to the age of the Galaxy of 10 Gyr
(Cowan et al. 1991).
Likewise, the age of the Galactic disk based upon the cooling
of white dwarfs, > 9.5 Gyr, is also consistent with
the globular cluster age
(Oswalt et al. 1996).
Recent type Ia supernova
data yield an expansion age for the Universe of 14.0 ± 1.5 Gyr, including
an estimate of systematic errors
(Riess et al. 1998).
Within the uncertainties, it is still possible that
H0t0
is slightly greater than one. This could either indicate a fundamental
inconsistency or the presence of a cosmological constant (or
something similar). A cosmological constant can lead to
accelerated expansion and H0t0 >
1. Recent measurements of
the deceleration of the Universe, based upon the distances of
high-redshift supernovae of type Ia (SNe1a), in fact show
evidence for accelerated expansion; we will return to these
interesting measurements later.
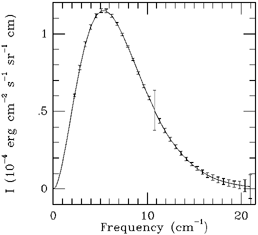
Figure 4. Spectrum of the Cosmic Microwave
Background Radiation
as measured by the FIRAS instrument on COBE and a black body
curve for T = 2.7277 K. Note, the error flags have been enlarged
by a factor of 400. Any distortions from the Planck curve are
less than 0.005% (see
Fixsen et al. 1996).
Another observational pillar of the Big Bang is the 2.73 K cosmic microwave
background radiation [CMB] (see
Wilkinson 1999).
The FIRAS instrument on the Cosmic Background Explorer [COBE] satellite has
probed the CMB to extraordinary precision
(Mather et al. 1990).
The observed CMB spectrum is
exquisitely Planckian: any deviations are smaller than 300 parts per
million
(Fixsen et al. 1996),
and the temperature is 2.7277 ±
0.002 K (see Fig. 4).
The only viable explanation for such perfect black-body radiation is the
hot, dense conditions that are predicted to exist at early times
in the hot Big Bang model. The CMB photons last scattered (with
free electrons)
when the Universe had cooled to a temperature of around 3000 K
(around 300,000 years after the Big Bang),
and ions and electrons combined to form neutral atoms. Since
then the temperature decreased as 1 + z, with the expansion preserving
the black body spectrum. The cosmological redshifting of the
CMB temperature was confirmed by a measurement of a temperature
of 7.4 ± 0.8 K at redshift 1.776
(Songaila et al. 1994)
and of 7.9± 1 K at redshift 1.973
(Ge et al. 1997),
based upon the population of hyperfine states in neutral carbon atoms
bathed by the CMB.
The CMB is a snapshot of the Universe at 300,000 yrs. From the
time of its discovery, its uniformity across the sky (isotropy)
was scrutinized. The first anisotropy discovered was dipolar
with an amplitude of about 3 mK, whose simplest interpretation
is a velocity with respect to the cosmic rest frame. The FIRAS
instrument on COBE has refined this measurement to high precision:
the barycenter of the solar system moves at a velocity of 370 ±
0.5 km s-1. Taking into account our motion around the center of
the Galaxy, this translates to a motion of 620 ± 20 km s-1 for
our local group of galaxies.
After almost thirty years of searching, firm evidence for
primary anisotropy in the CMB, at the level of 30 µK
(or
The final current observational pillar of the standard cosmology is
big-bang nucleosynthesis [BBN]. When the Universe was seconds old
and the temperature was around 1 MeV a sequence of nuclear reactions
led to the production of the light elements
D, 3He, 4He and 7Li.
In the 1940s and early 1950s, Gamow and his collaborators suggested
that nuclear reactions in the early Universe could account for
the entire periodic table; as it turns out Coulomb barriers and the lack
of stable nuclei with mass 5 and 8 prevent further nucleosynthesis.
In any case, BBN is a powerful and very early test of the standard
cosmology: the abundance pattern of the light elements predicted
by BBN (see Fig. 6) is consistent
with that seen in the most primitive samples of the cosmos.
The abundance of deuterium is very sensitive to the density of
baryons, and recent measurements of the deuterium abundance
in clouds of hydrogen at high redshift
(Burles & Tytler 1998a,
b)
have pinned down the baryon density to
a precision of 10%.
Figure 6. Predicted abundances of
4He (mass
fraction), D, 3He, and 7Li
(relative to hydrogen) as a function of the baryon density.
The broader band denotes the concordance interval based upon all
four light elements. The narrower, darker band highlights
the determination of the baryon density based upon
a measurement of the primordial abundance of the most sensitive of
these - deuterium
(Burles & Tytler 1998a,
b),
which implies
As Schramm emphasized, BBN is also a powerful probe of fundamental
physics. In 1977 he and his colleagues used BBN to place a
limit to the number of neutrino species
(Steigman et al. 1977),
N
Figure 7. The dependence of primordial
4He
production, relative to hydrogen, YP, on the number
of light neutrino species. The vertical band denotes the
baryon density inferred from the Burles - Tytler measurement
of the primordial deuterium abundance
(Burles & Tytler 1998a,
b);
using YP < 0.25, based upon current 4He
measurements, the BBN limit stands at
N

 T/T
T/T  10-5) on angular scales
of 10°
was found by the DMR instrument on COBE (see Fig. 5).
The importance of this discovery was
two-fold. First, this is direct evidence that the Universe at early
times was extremely smooth since density variations manifest
themselves as temperature variations of the same magnitude.
Second, the implied variations in the density were of the correct
size to account for the structure that exists in the Universe today:
According to the standard cosmology the structure seen today grew
from small density inhomogeneities (
 /
/  ~ 10-5)
amplified by the attractive action of gravity over the past 13 Gyr.
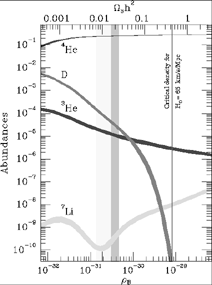
 Bh2 = 0.02 ± 0.002.
 < 7, which, at
the time, was very poorly constrained by laboratory
experiments, N
 less
than a few thousand. The limit is based upon the
fact that the big-bang 4He yield increases with
N
 ;
see Fig. 7). In 1989, experiments done
at e± colliders at CERN and SLAC
determined that N
 was equal to three, confirming the cosmological
bound, which then stood at N
 < 4. Schramm used the BBN limit
on N
 to pique the
interest of many particle physicists in
cosmology, both as a heavenly laboratory and in its own right.
This important cosmological constraint, and many others that followed,
helped to establish the ``inner space -
outer space connection'' that is now flourishing.
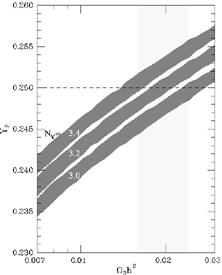
 < 3.4 (from
Schramm and Turner
1998).