4.4 Summary, One- and Two-Sample Tests
Table IV, adapted from Siegel & Castellan (1988), attempts a summary, demonstrating an apparent wide world of non-parametric tests available for sample comparison; but is this really so? In deciding which test(s) are relevant, the following points should be noted; the decision may be made for you.
The two-sample and k-sample cases each contain columns of tests for related samples, i.e. matched-pair samples or samples of paired replicates. This is common experimental practice in biological and behavioural sciences, where the concept of the control sample is highly developed. It is not so common in astronomy for obvious reasons, but has been exploited on occasion. The powerful tests available to treat such experiments are listed in Table IV, and are described by Siegel & Castellan.
The table runs downward in order of increasing sophistication of measurement level, from ``nominal'' (in which the test objects are simply dumped into classes or bins) through ``ordinal'' (by which objects are ranked or ordered) to ``interval'' (for which objects are placed on a scale, not necessarily numerical, in which distance along the scale matters). None of the tests requires measurement on a ``ratio'' scale, the strongest scale of measurement in which to the properties of the ``interval'' scale a true zero point is added. (Degrees Celsius for temperature measurement represents an ``interval'' scale, and Kelvins a ``ratio'' scale.) An important feature of test selection lies in the level of measurement required by the test: the table is cumulative downward in the sense that at any level of measurement, all tests above this level are applicable.
The efficiency of a particular test depends very
much on the
individual application. Is the search for goodness-of-fit and general
difference, i.e. is this sample from a given population? Are these
samples from the same population? Or is it a particular property of
the distribution that is of interest, such as the location,
e.g. central tendency, mean or median; or the dispersion
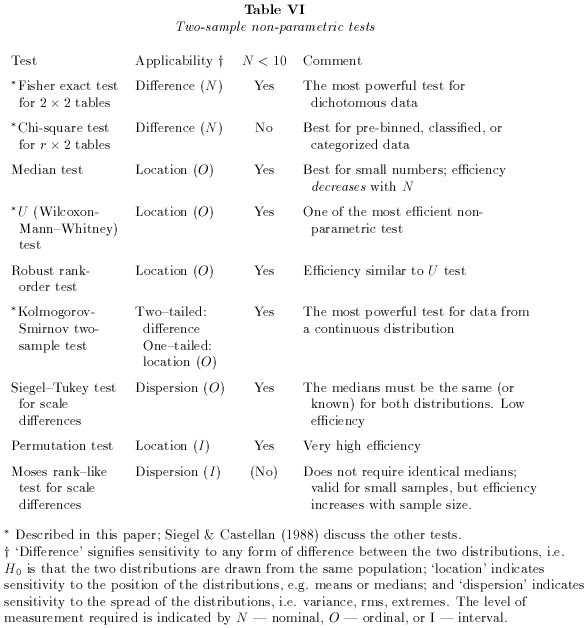
e.g. extremes, variance, rms. For instance in the two-sample case, the
 2 and the
Kolmogorov-Smirnov (two-tailed) tests are both sensitive to
any type of difference in the two distributions, location, dispersion,
skewness, while the U test is reasonably sensitive to most properties,
but is particularly powerful for location discrimination. To aid the
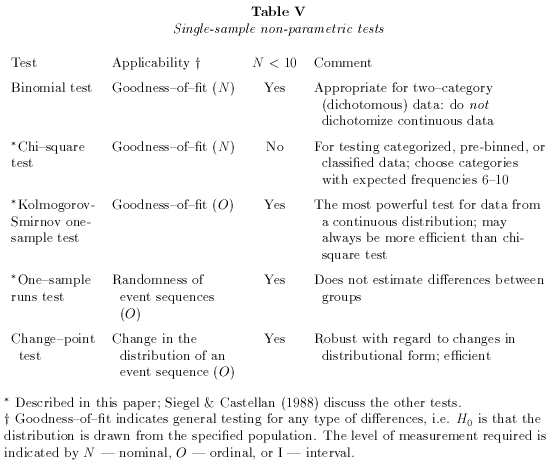
process of choice, Tables V (single samples) and
VI (two samples)
summarize the attributes of the one- and two-sample tests.
2 and the
Kolmogorov-Smirnov (two-tailed) tests are both sensitive to
any type of difference in the two distributions, location, dispersion,
skewness, while the U test is reasonably sensitive to most properties,
but is particularly powerful for location discrimination. To aid the
process of choice, Tables V (single samples) and
VI (two samples)
summarize the attributes of the one- and two-sample tests.
The choice of test may thus come down to Hobson's. If it does not,
however, and two (or more) alternatives remain - beware of this plot
of the devil - it might be possible to ``test the tests'' in search of
support of a point of view. If such a procedure is followed,
quantification of the amount by which significance is reduced must be
considered: for a chosen significance level p in a total of N tests,
the chance that one test will (randomly) come up significant is
Np (1 - p)N-1  Np for small p. The application of
efficient statistical procedure has power, but the application of common
sense has more.
Np for small p. The application of
efficient statistical procedure has power, but the application of common
sense has more.