Database Contents
-
This table gives NED's current total holdings:
| Data Type | Total |
|---|---|
| Sources and Objects | |
| Unprocessed Catalog Sources (not cross-matched) | 472,607,072 |
| Distinct Objects | 253,093,225 |
| Multiwavelength Cross-IDs | 301,205,297 |
| Object Associations | 1,413,595 |
| References | |
| Distinct References | 107,427 |
| Publication Abstracts | 81,128 |
| Object Links to References | 40,641,817 |
| Data | |
| Photometric Data Points | 2,330,215,150 |
| Diameters | 608,833,152 |
| Redshifts | 11,324,496 |
| Objects with Redshifts | 5,925,648 |
| Redshift-Independent Distances | 111,821 |
| Objects with Redshift-Independent Distances | 27,151 |
| Detailed Classifications | 502,105 |
| Objects with Detailed Classifications | 229,792 |
| Detailed Object Notes | 75,392 |
| Images | 2,529,532 |
| Spectra | 578,203 |
Object Type Distribution
-
This table gives the distribution of selected, abundant NED object types (as of May 2016):
| Object Type | Count |
|---|---|
| Extragalactic | |
| Galaxy (G) | 102,490,023 |
| Quasar (QSO) | 172,496 |
| Galaxy Cluster (GClstr) | 158,510 |
| Galaxy Group (GGroup) | 94,088 |
| Galaxy Pair (GPair) | 29,087 |
| Galaxy Triple (GTrpl) | 7,240 |
| Unclassified | |
| Point Source (*) | 68,272,147 |
| UV (UvS) | 37,351,595 |
| Radio (RadioS) | 2,039,420 |
| Visual (VisS) | 1,824,359 |
| IR (IrS) | 1,673,335 |
| X-ray (XrayS) | 413,959 |
| UV Excess (UvES) | 130,901 |
| Gamma ray (GammaS) | 5,551 |
| Parts of Galaxies | |
| HII region (HII) | 34,007 |
| Star Cluster (*Cl) | 28,103 |
| Variable Star (V*) | 13,754 |
| Supernova (SN) | 9,402 |
| Molecular Cloud (MCld) | 2,082 |
| Milky Way Stars | |
| Star (!*) | 89,729 |
| White Dwarf (WD*) | 9,510 |
| Variable (!V*) | 4,269 |
Sky Density

The distribution of NED objects on the sky as of 2016 November. The data are plotted in Galactic coordinates. The color bar shows the number density ranging from 0 (black) to 3.6 million (red) objects per square degree.
Redshift Distribution

The spectroscopic and photometric redshift (look-back time) distributions of NED objects as of 2015 April.
Comparison to Model Predictions
We present here preliminary results (NED 2015, in prep.), comparing the NED spectroscopic redshift distribution at z<0.3 with a simple cosmological model. This gives an idea of the relative completeness of NED as a function of redshift.
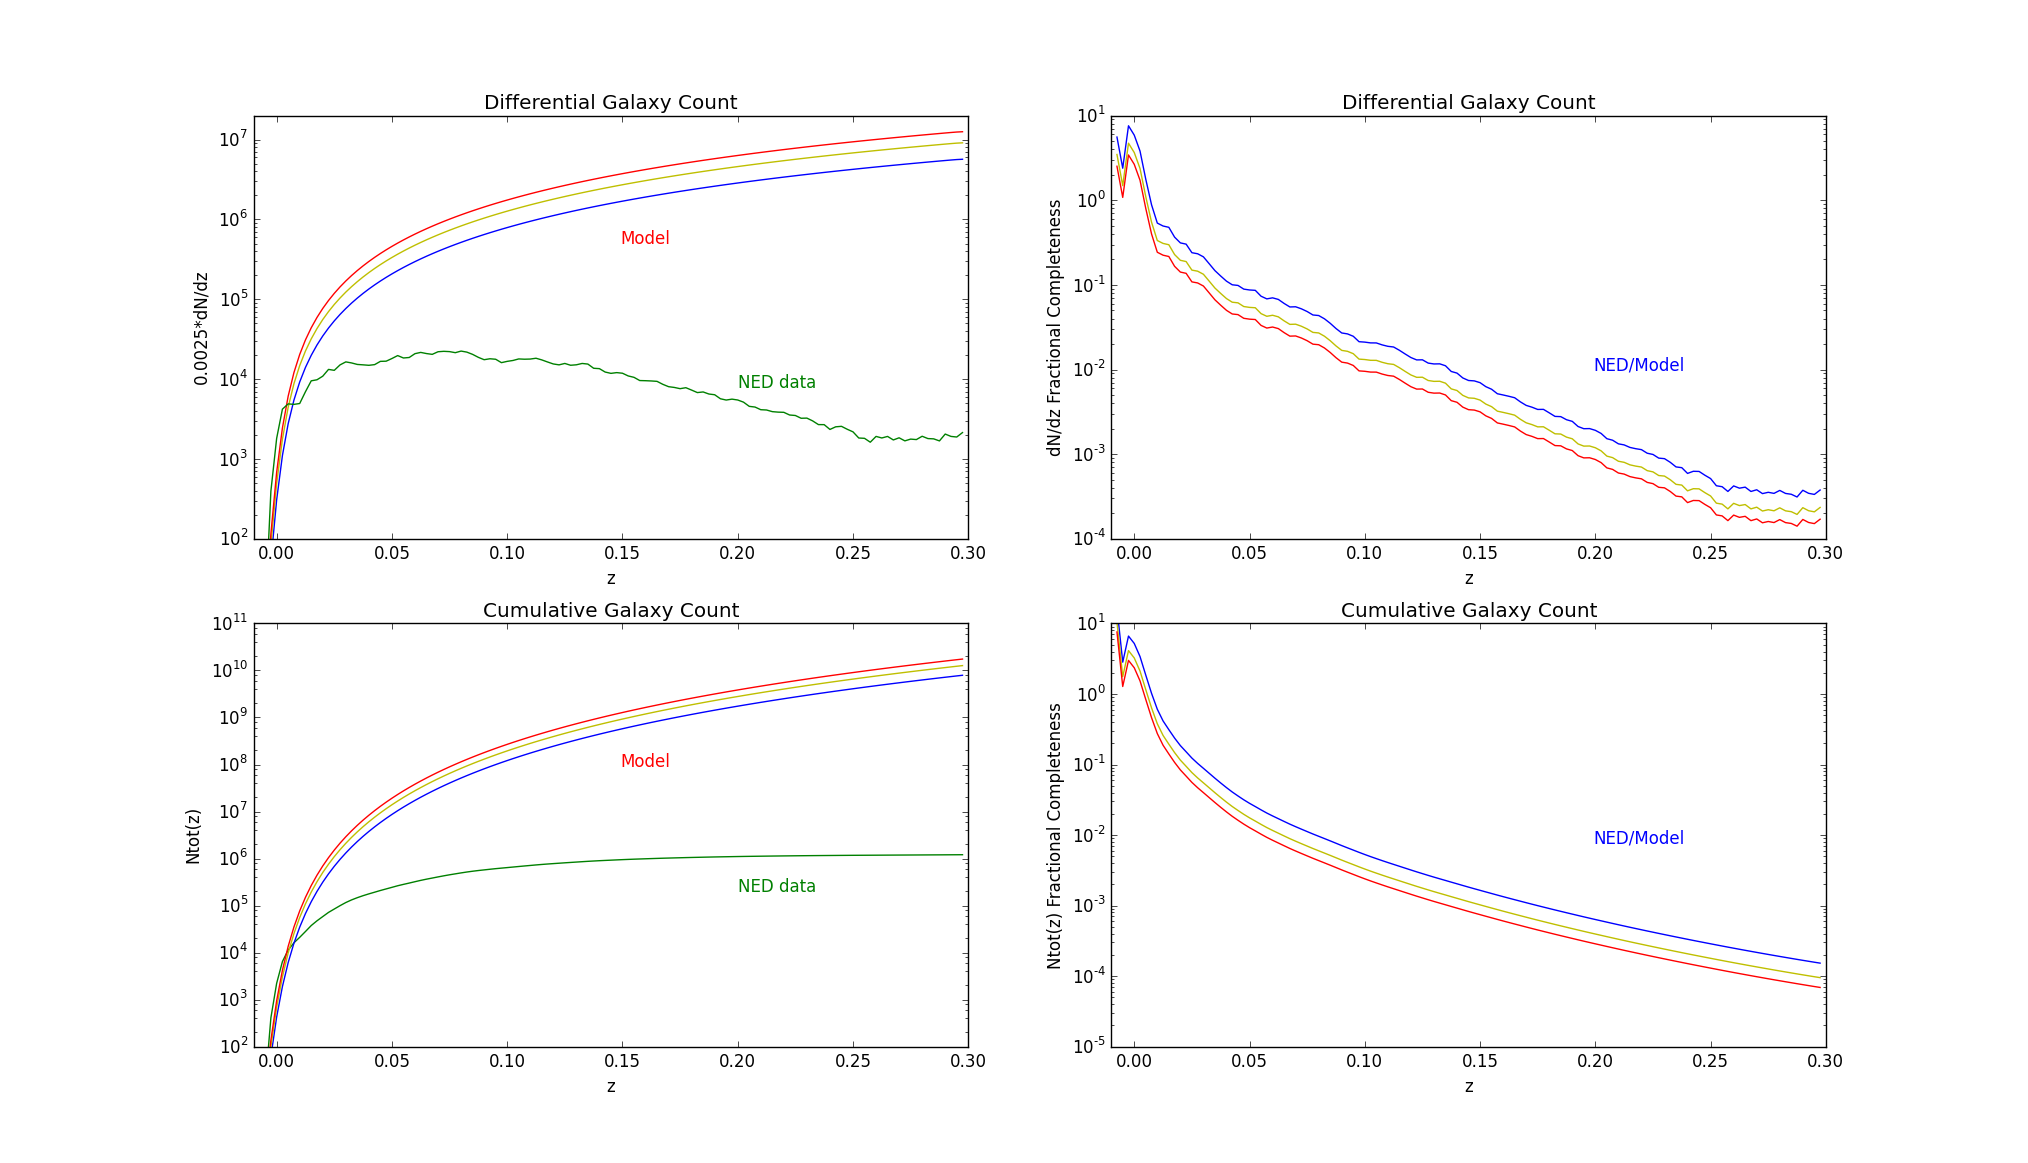
(Top left) Differential counts of galaxies with spectroscopic redshifts (~1 million with z<0.3) in NED. These are compared to model predictions of the galaxy redshift distribution, obtained by multiplying the comoving volume element by an empirical estimate of the galaxy number density. We assume that galaxy number density is redshift-independent at these low redshifts, and estimate its value by integrating over published Schechter function fits to the observed galaxy luminosity function (e.g., Blanton et al. 2003; Zucca et al. 2012 ), with a lower luminosity cutoff of L/L*=0.0001. We assume a cosmology with H0=68 km/s/Mpc, Omega(matter)=0.3, Omega(Lambda)=0.7, and Omega(k)=0.0. The three model curves show the median and 1-sigma variation in published estimates of the average galaxy density in this redshift range. The size of the redshift bins is dz=0.0025. (Top right) Ratio of differential counts to model counts. (Bottom left) Cumulative counts of galaxies with spectroscopic redshifts in NED. (Bottom right) Ratio of cumulative counts to model counts.
NOTE: The low fractional completeness (<0.1 at z>0.03) is characteristic of modern spectroscopic surveys which either cover a small solid area on the sky, or target a selected subsample of galaxies within their survey area. NED does its best to incorporate all available published redshifts, and we will update these figures as new data are added.