


2.3.10. Direct Astrophysical Distance Measurements
The previous, cumbersome and somewhat tedious discussion should have convinced the reader that the determination of a precise value for H0 requires a distance measuring technique which completely bypasses the distance scale ladder. There are many steps on the ladder where systematic error comes into play and the entire technique is always open for criticism on the basis of bias associated with sample selection. Direct astrophysical distance indicators do not rely on distance estimates to intermediate galaxies and hence have the potential of providing definitive distances. Furthermore, these techniques can be applied over large distances where any perturbation from expansion velocity becomes negligible. However, these direct indicators are extremely model-dependent, as they rely on the astrophysics of some process to provide the distance and that astrophysics must be modeled. Still, this is a major improvement as various protagonists can now argue over the physics of the situation, rather than sample selection techniques. To date, the most promising kinds of direct astrophysical distance measurements are the following:
The Sunyaev-Zeldovich (SZ) effect
The CMB radiation is nearly a perfect blackbody with temperature of 2.74 K.
When this radiation passes through a cluster of galaxies that has a
hot Intracluster Medium (ICM - see Chapter 3),
then hot electrons in that
plasma scatter the CMB photons to higher energies and thus distort
the original blackbody spectrum. The overall effect is to increase
the CMB photon energies preferentially at the shorter wavelengths.
At longer wavelengths, this effect causes a net reduction in
the temperature of the background radiation that passes through the
cluster plasma. The measured decrease in temperature,
 T / T,
depends on the total amount of scattering which in turn depends on
the electron temperature (Te), the electron density
(ne) and
path length through the plasma (dl). The temperature decrement can then
be formulated as
T / T,
depends on the total amount of scattering which in turn depends on
the electron temperature (Te), the electron density
(ne) and
path length through the plasma (dl). The temperature decrement can then
be formulated as
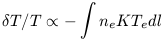
| (15) |
It is convenient to replace the integral in equation 15 with average mean values for ne and Te, thus
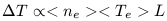
| (16) |
where L is now the physical path length. To estimate the mean values of ne and Te we can make use of the observed X-ray flux, Sx
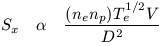
| (17) |
where V = the volume of the cluster, np = ion density
and D = distance from the observer to the cluster. In thermal
equilibrium np  ne. For a spherical
cluster V
ne. For a spherical
cluster V  L3. More generally,
V
L(
L3. More generally,
V
L( x
y)
(D2) where
xy is the
angular size of the cluster in projected coordinates x and y.
Using equation
15 to solve for ne2 and inserting that into
equation 17 yields
x
y)
(D2) where
xy is the
angular size of the cluster in projected coordinates x and y.
Using equation
15 to solve for ne2 and inserting that into
equation 17 yields
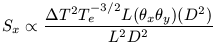
| (18) |
which becomes
| (19) |
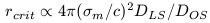
Everything on the left hand side of equation 19 is a measurable quantity from which the physical path length can be measured. Once the physical size of the cluster is known, its angular size on the sky can be used to determine D and hence H0. This method has been applied to a few clusters and the derived values of H0 are generally in the range 25 -75. The most recent determination is based on observations of the Coma cluster where Herbig et al. (1995) derive H0 = 74 ± 29. The large error bar is a reflection of the difficulty of this method as there are several complications:
 Any small scale structure in
the X-ray gas is fatal as the
method uses smooth, average values of ne and
Te. Small scale
clumping of the gas in which there are differences in
ne and Te
will produce spurious results.
Any small scale structure in
the X-ray gas is fatal as the
method uses smooth, average values of ne and
Te. Small scale
clumping of the gas in which there are differences in
ne and Te
will produce spurious results.
Te must be
determined and in general, it is quite difficult
to determine X-ray temperatures from the extant data due to limited
spectral coverage of most X-ray detectors.
The measurements of the
microwave background decrement itself
are very hard. The Herbig et al. data are made with the best system
currently available for measuring this and hence they probably have
the most credible result.
The method really works best
for perfectly spherical clusters
(where xy can just
be replaced by L2). Irregularly shaped
clusters can cause spurious errors.
Since the SZ effect itself
is one of a frequency shift it
can be simulated if the cluster itself is moving. In this case,
 T
T
 v / c. For the case of
a cluster moving with respect to the CMB reference frame at
1000
km s-1, then
T will have
the same value as it would
in the case of a non-moving plasma with Te
1 kev.
v / c. For the case of
a cluster moving with respect to the CMB reference frame at
1000
km s-1, then
T will have
the same value as it would
in the case of a non-moving plasma with Te
1 kev.
Because of all these complicating effects, distances derived from the SZ effect are highly suspect and model dependent. The most serious of these complications involves fine-scale structure in the X-ray emitting plasma. Recent data from new X-ray satellites such as ROSAT which is capable of detecting this fine-scale structure, and ASCA which is capable of measuring temperatures directly (provided the signal strength is high) should offer improved SZ distances to some clusters in the near future.
Gravitational Lensing
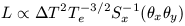
Gravitational lensing occurs whenever the light from a distant point source passes very near by a massive object. The space around that object is distorted and the light path can take on a number of different trajectories which can reach the observer. Hence, the observer sees not only multiple objects but in some cases amplified objects, depending upon the nature of the mass concentration. The details of this were first laid out by Refsdel (1964). For the case of the light from a distant point source encountering an isothermal sphere the critical radius for lensing and amplification is given by
| (20) |
where  m is the
velocity dispersion of the lensing mass.
To a reasonable degree of approximation (see
Chapter 3) clusters of
galaxies have a potential like that of an isothermal sphere and hence,
in principle, can be gravitational lenses.
DLS is the angular diameter
distance between the lens and the source and DOS is
the angular diameter
distance between the observer and the source. In more descriptive terms,
rcrit is related to differences in the potential that
the multiple
light paths take. These potential differences give rise to delays in
arrival times of the light from these multiple components that reaches
an observer. DLS can be approximately determined if
the redshifts of both
the lensing source and the lensed object are unknown (in general the
redshift of the lens is not known) and
m can, in principle
be measured as well.
m is the
velocity dispersion of the lensing mass.
To a reasonable degree of approximation (see
Chapter 3) clusters of
galaxies have a potential like that of an isothermal sphere and hence,
in principle, can be gravitational lenses.
DLS is the angular diameter
distance between the lens and the source and DOS is
the angular diameter
distance between the observer and the source. In more descriptive terms,
rcrit is related to differences in the potential that
the multiple
light paths take. These potential differences give rise to delays in
arrival times of the light from these multiple components that reaches
an observer. DLS can be approximately determined if
the redshifts of both
the lensing source and the lensed object are unknown (in general the
redshift of the lens is not known) and
m can, in principle
be measured as well.
|
Figure 2-23: CCD image showing the double quasar Q 0957+561. Obtained by Dr. Rudolph Schild, Smithsonian Astrophysical Observatory and reproduced with permission. |
To date, one system has been discovered that lends itself to this kind of analysis. The distant quasar Q 0957+561 (see Figure 2-23) is lensed by a foreground cluster of galaxies of known redshift. The two brightest images of the quasar are known as A and B. For a particular model of the lensing geometry and the mass distribution of the cluster it can be shown (see Falco et al. 1991; Surpi et al. 1996) that
| (21) |
where
 AB-1 is the
measured time delay.
The principle advantage of using lensed QSOs is that, in general, QSOs
are variable in their luminosity output at all wavelengths. Continuous
monitoring of this system at both radio and optical wavelengths can then
determine
AB-1. Radio
observations are less susceptible to sampling gaps caused by poor
weather.
AB-1 is the
measured time delay.
The principle advantage of using lensed QSOs is that, in general, QSOs
are variable in their luminosity output at all wavelengths. Continuous
monitoring of this system at both radio and optical wavelengths can then
determine
AB-1. Radio
observations are less susceptible to sampling gaps caused by poor
weather.
|
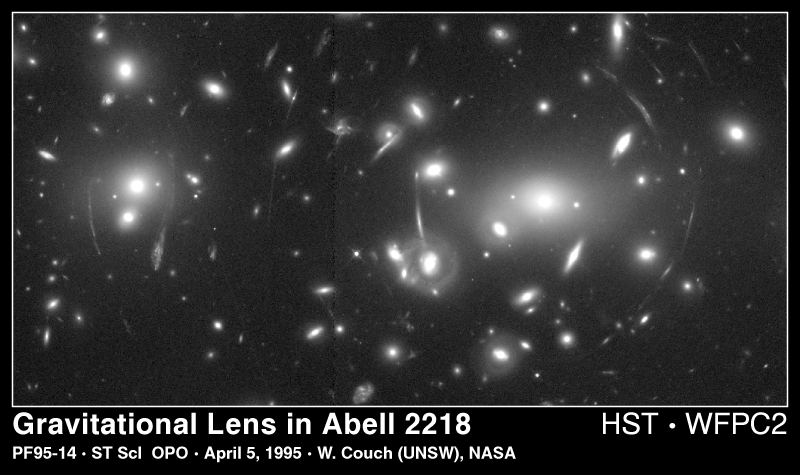
Figure 2-24: Spectacular image of arclets and rings representing gravitational lensing associated with the cluster Abell 2218. CCD image taken with the Hubble Space Telescope. |
Although this method of determining H0 is quite promising because it is based on real physics, there are, at present three main limitations:
Only one source (Q 0957+561)
has been discovered to date that is suitable
and deriving H0 on the basis of the statistics of one
event is dubious.
The time delay is actually
quite difficult to measure because
it is so long. For Q 0957+561,
AB-1 is of order
1.5 years. In the optical, the components are sufficiently faint that
they can not be measured in moonlight which results in significant
gaps and irregular sampling in the timing data. Reconstruction of
the intrinsic time delay from irregularly sampled data is difficult.
Because of this the radio data
provides the best means for estimating the time delay. In fact
for Q 0957+561 there has been somewhat of a controversy
regarding the
value for
AB-1 as
values of either 415 or 535 days
can fit the timing data. Very recently, Turner et al. (1996) present
convincing data in favor of the 415 day period.
The intrinsic density
distribution of the lens itself must
be known. For clusters of galaxies (Chapter 3)
this is almost
impossible to know. Detailed maps of the x-ray distribution can help
in this regard. In addition to Q 0957+561, faint background galaxies
are also lensed. As these galaxies are not point sources, their
multiple images are not point sources; instead they are thing arcs or
arclets (Figure 2-24). In principle, the
size of these arcs is related to the mass distribution in the lens.
Fischer et al. (1996) have used observations of lensed galaxies to
determine the mass distribution of the lensing cluster towards
Q 0957+561. Interestingly, their results do not
agree very well with the mass
distribution which has been inferred from the X-ray map of the cluster.
Because of the difficulty in determining the mass distribution of the
lens, derivations of H0 from this method are not yet
credible.
For the Q 0957+561 system, the strongest statement which can
be made from the observed time delay and reasonable modeling of the mass
distribution is that H0
 90 ± 30 km s-1 (see
Kochanek 1991).
90 ± 30 km s-1 (see
Kochanek 1991).
Superluminal Motion in Radio Sources
It has been known for
20 years that some radio sources have small-scale components which seem
to be separating from one another at a velocity that exceeds the
speed of light. This is now understood to be an illusion which is
caused by the relativistic acceleration of a plasma down a beam pipe which
is pointed at the observer. The knots which are seen in the radio jets
are shocks in this relativistic flow. These knots often exhibit cm-waveband
variability which is due to the passage of these shocks through the
optically thick
surface of the flow. During this passage the flux increases, followed
by adiabatic energy loss and a decline in the flux. The increase in the
percentage polarization that accompanies such activity is associated with the
shock compression of an initially tangled magnetic field, establishing a
`preferred direction', and causing a significant percentage polarization for
observers viewing radiation emitted in the plane of the compression
Novel work by Phillip Hughes and his collaborators at the University of
Michigan have used this relationship between increased polarization and
maximum superluminal motion to construct a geometrical shock model which allows
the distance to the source to be determined. In this model,
description of the flow dynamics makes use of
the analytic jump conditions for shocks in a relativistic gas. Predicted
polarized flux light curves are obtained by performing
radiation transfer calculations through the plasma at many epochs. Although the
models contain a large number of free parameters, they can be well-constrained
because of the wealth of information contained in high time resolution,
multi-frequency, flux and polarization data. In particular, the shape of the
total flux profile is strongly influenced by time delay effects, and thus by
viewing angle, while the degree of polarization is sensitively dependent on
relativistic aberration and hence on flow speed and viewing angle. Models of
two well-defined outbursts in the source BL Lac that occurred in the
early 1980s
have an optimal fit to both the light curve profile and percentage polarization
for an angle of view of almost 40°. With angle of view and flow speed
known, the apparent speed of structures can be calculated, and thus the
angular separation rate of source components can be predicted as a function of
cosmological distance. Comparison with the actual rate, determined by VLBI,
allows the distance to be determined, and when combined with the known
redshift, H0 may be estimated. An initial application
of this technique
yielded a value somewhat in excess of 100 km s-1 Mpc-1.
Although more refined models admit a somewhat smaller viewing angle, and
smaller value of H0, an important point is that at
these large angles of
view (which have received strong support from independent modeling of VLBI
data), no source speed is compatible with values of
H0 close to 50
km s-1 Mpc-1, because the apparent component speed is
too small, and superluminal motion in BL Lac would simply not be observed
(see Hughes et al. 1991).
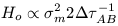
Virial Masses:
This is a straightforward procedure but it is unlikely to be applicable
to any real astrophysical source due to the presence of dark matter.
The dynamical mass of a rotating cloud of gas is
where R is some characteristic physical scale. R is related
to distance via D
and only one value of D satisfies the observational constraints
provided by F0 and Vc. This
technique has been applied to
one gas-rich system to date by Staveley-Smith et al. 1990 resulting
in an upper limit on H0 of 70 ± 7. If other
gas-rich systems
can be detected and if they have reasonable dynamics, then this method
may provide a statistically interesting measure of H0.
In sum, consideration of the possible forms of direct astrophysical
distance measures has yielded some promising candidates. The principle
limitations are 1) the availability of real astrophysical sources that
are ideal and 2) resulting values of H0 remain model
dependent.
However, the mere fact that these astrophysical distance measures
are returning values of H0 that do lie in the range 50
- 100 is quite
encouraging and hence continued pursuit in this direction is a viable
and appealing alternative to having to derive H0 via
the cumbersome distance scale ladder.
 -cone' of the flow sees
both maximum possible superluminal motion, and high percentage polarization,
because aberration causes radiation emitted in the plane of a shock traveling
along the flow to be swung into the line of sight.
-cone' of the flow sees
both maximum possible superluminal motion, and high percentage polarization,
because aberration causes radiation emitted in the plane of a shock traveling
along the flow to be swung into the line of sight.
(22)
where
is the angular size of the
gas cloud. If we
imagine that this cloud has no dark matter in it and no stars such
that the gas comprises 100% of the dynamical mass then the distance
follows directly as we can use the observed flux (F0)
of emission from
that gas (assume that it is neutral hydrogen). In this case

(23)