

3.5.2. The Coming of the Stickman
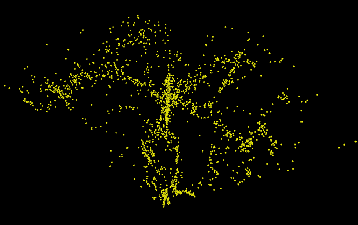
The basic strategy of the Slice surveys were devised by Margaret Geller at the Smithsonian Astrophysical Observatory. In addition to the survey design, Geller also developed novel and sophisticated techniques for analyzing the data in order to properly characterize the features which were seen. The first slice survey was completed in 1986 (e.g., de Lapparent et al. 1986) and the initial results were astounding (and remain so). Figure 3-11 is by now quite famous and is commonly referred to as the "Stickman" figure. In this figure we see the essence of the complex galaxy structure which is defined by the Slice survey. In this representation of the data, the Slice dimension (equivalent to latitude in the analogy above) has been collapsed so the axes represent angular distance on the sky and redshift distance from the earth. In the absence of peculiar velocities, redshift distance is equivalent to physical distance. The opening angle of the survey represents the angular extent of the slice. There are several features to note:
 Any virialized structure
will appear as a vertical structure
pointed towards the origin (the observer). Galaxies in these structures
have nearly the same physical distance from the observer, but the velocity
dispersion of the structure stretches their location in redshift space.
The main body of the Stickman is
defined by such a structure - in this case, the Coma Cluster of
galaxies.

|
Figure 3-11: Large scale structure is seen in the Slice of the Universe first published by de Lapparent et al. (1986). The opening angle of the vertex represents the angular extent of the strip survey and the width in declination has been collapsed. Each galaxy is plotted at its redshift distance from the Earth. Virilized structures, such as the Coma cluster in the center of the image, appear as linear features pointed directly at the observer. This representation of the Large Scale Structure clearly reveals the presence of voids. This representation was originally done by Lars Lindberg Christensen, University of Copenhagen, Denmark. |
 The apparent arms of the
Stickman represent "Walls". These
are relatively low density regions (so low density that many pencil
beams surveys can probe a wall but not intersect any galaxies) which
are stretched out in angular space over several hundred million light
years. These are the largest structures yet discovered with the very
largest known as the Great Wall (see
Geller and Huchra 1989). They seem to
represent a concentration of galaxies on an imaginary surface. This
has given rise to the viewpoint that large scale features are the
result of the expansion of voids piling up and collecting material
along their boundaries (see Weinberg et al. 1989). As we discuss later,
its somewhat difficult to account for these kinds of structures under
the standard gravitational instability paradigm.
 Regions in which there are
little or no galaxies. In general these regions appear fairly round.
These regions are called voids. A typical void has a "redshift"
diameter of 3500-5000 km s-1; i.e. a typical void is much
larger than
the volume defined by the Local Group - Virgo Cluster concentration
of galaxies.
These Slice surveys have revealed striking coherent structures in the large scale galaxy distribution. The sharp and dense edges of the voids strongly suggest that the process of galaxy and cluster formation is triggered, in some way, by the intersecting surfaces of voids. Current Slice surveys suggest that the filling factor of voids in the Universe is about 75% and that there is some probability distribution that can described void sizes. But this probability distribution is based on the current data set and if we have not yet surveyed a fair volume then we have not yet identified the largest void.