Copyright © 1992 by Annual Reviews. All rights reserved
| Annu. Rev. Astron. Astrophys. 1992. 30:
359-89 Copyright © 1992 by Annual Reviews. All rights reserved |


2.1 Light Curves
The similarity of the shapes of the light curves of type I supernovae
was pointed out by
Pskovskii (1967) and
Kowal (1968).
Apparent
differences in the shape of the blue (pg and B) light
curves, which had been noticed by
Schmidt (1957),
were accepted as real by Pskovskii
(1970,
1977)
and expressed by a continuously varying parameter,
 ,
that measures the decline rate. A large body of photometric data was
analyzed by
Barbon et al (1973)
who concluded that SNe I do indeed
have remarkably similar blue light curves, but they discussed the
possibility of a dichotomy between ``fast'' and ``slow'' SNe I (see also
Barbon 1980).
The variety in the tight curves seemed even more
significant when correlations between the maximum brightness and the
decline rate were
suggested
(Rust 1974;
de Vaucouleurs &
Pence 1976;
Pskovskii 1977;
Branch 1981,
1982).
These differences became less convincing, however, when the analysis was
restricted to the best observed SNe I
(Tammann 1978,
1982).
The infrared light curves also revealed an impressive uniformity
(Elias et al 1981).
The data available to
Cadonau et al (1985)
showed that modern B magnitudes
scatter significantly less about a mean template light curve than the
generally older pg magnitudes, and cast doubt upon the distinction
between fast and slow SNe I. A compilation of all optical magnitudes
of SNe I in the literature
(Cadonau &
Leibundgut 1990)
allowed the construction of template light curves in the UBV
(Cadonau 1987) and
JHK bands
(Leibundgut 1988,
hereafter L88). Four particularly well
observed SNe Ia have a mean scatter about the template light curves
for the six bands of only
,
that measures the decline rate. A large body of photometric data was
analyzed by
Barbon et al (1973)
who concluded that SNe I do indeed
have remarkably similar blue light curves, but they discussed the
possibility of a dichotomy between ``fast'' and ``slow'' SNe I (see also
Barbon 1980).
The variety in the tight curves seemed even more
significant when correlations between the maximum brightness and the
decline rate were
suggested
(Rust 1974;
de Vaucouleurs &
Pence 1976;
Pskovskii 1977;
Branch 1981,
1982).
These differences became less convincing, however, when the analysis was
restricted to the best observed SNe I
(Tammann 1978,
1982).
The infrared light curves also revealed an impressive uniformity
(Elias et al 1981).
The data available to
Cadonau et al (1985)
showed that modern B magnitudes
scatter significantly less about a mean template light curve than the
generally older pg magnitudes, and cast doubt upon the distinction
between fast and slow SNe I. A compilation of all optical magnitudes
of SNe I in the literature
(Cadonau &
Leibundgut 1990)
allowed the construction of template light curves in the UBV
(Cadonau 1987) and
JHK bands
(Leibundgut 1988,
hereafter L88). Four particularly well
observed SNe Ia have a mean scatter about the template light curves
for the six bands of only
 m = 0.06-0.18 mag
(Leibundgut 1990).
From an atlas of the optical light curves of 75 SNe I
(Leibundgut et al
1991a, hereafter LTCC91)
it is clear that most SNe I comply with the templates within the
photometric errors.
m = 0.06-0.18 mag
(Leibundgut 1990).
From an atlas of the optical light curves of 75 SNe I
(Leibundgut et al
1991a, hereafter LTCC91)
it is clear that most SNe I comply with the templates within the
photometric errors.
It should be pointed out that the photometry of supernovae is particularly difficult. Photographic photometry requires the setup of an auxiliary local standard sequence. Any zero-point and scale errors in this sequence translate into a magnitude shift and a distortion of the light curve. Photoelectric photometry is sensitive to the background light of the parent galaxy. As the supernova fades the increasing influence of the background distorts the light curve (Boisseau & Wheeler 1991). Even CCD photometry is not above suspicion. The transient phenomenon of a supernova frequently requires the use of nonphotometric nights which do not allow the proper determination of the night's photometric coefficients. Bewildering differences between the photometry of the same supernova by different authors give a vivid illustration of these problems. Deviations from the template in one pass band, for a supernova that appears standard in the other pass bands, are likely to be the result of photometric errors. In general the true deviations from the templates must be smaller than observed.
Because this review is concerned with supernovae of type Ia, we merely note in passing that the recognition of the additional subtypes SN Ib (Wheeler & Levreault 1985, Uomoto & Kirshner 1985, Panagia 1985) and SN Ic (Harkness & Wheeler 1990) had little effect on the discussion of the SN Ia optical templates, because the different subtypes have, at least during the earlier phases, surprisingly similar light curves (Ensman & Woosley 1988, Schlegel & Kirshner 1989, Wheeler & Harkness 1990, Leibundgut & Tammann 1992 - hereafter LT92). In the infrared, however, the light curves of SNe Ib and Ic are distinctly different from those of SNe Ia (Elias et al 1985, L88).
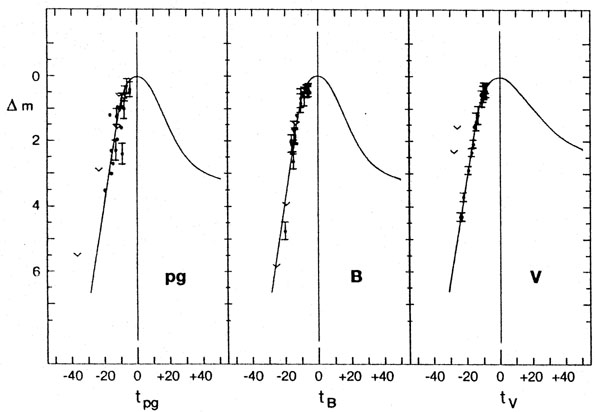
The standard UBVJHK light curves of SNe I are discussed by LT92, whose main conclusions concerning SNe Ia are as follows. The duration of the rising branch of the light curve is easily underestimated because it is difficult to catch a supernova just after explosion. As Pskovskii (1971) pointed out, the time to reach the blue maximum is longer than 15 days, a value which nevertheless is still frequently used in the literature. Figure 1 shows photometry of the rising light curve. The time scales tpg, tB, and tV are counted in days from the pg, B, and V maxima, respectively, and the error bars are determined from the scatter of the post-maximum data of the same authors. SN 1961D was discovered 21 days before V maximum (Zwicky 1961) which corresponds to 18.5 before B maximum (see below), i.e. tB = - 18.5 days. SN 1979B was discovered even earlier, at tB = -19.5 (Rosino 1979, Barbon et al 1982). SN 1971G and SN 1937D were observed at tB = -17.5 (Rosino 1971) and tB -16 (Hoffleit 1939), respectively. SN 1981D was traced back to tB = -15.3 (Hamuy et al 1991). These are minimum values for the true rise time, although they are affected by errors in the epoch of maximum by about ± 1 day. The conclusion that the typical rise time to B maximum lasts at least 19-20 days has been supported recently by SN 1990N (Leibundgut et al 1991b). It may be noted here that Kepler's supernova (to be discussed in Section 3.1) was seen 16 days before the visual maximum, i.e. at tB = -13.5, and its visual light curve agrees reasonably well with the SN Ia template. The agreement becomes even better when allowance is made for the distorting effect of the large, variable extinction, AV. The value of AV changes with phase because of the width of the V passband and the strong color evolution of supernovae (L88).
|
Figure 1. The rising part of SN Ia light curves (adapted from Cadonau 1987). |
Near maximum SNe Ia redden rapidly, which causes them to reach U maximum about 2.8 days before, and V maximum about 2.5 days after, B maximum. The infrared magnitudes, however, do not follow this trend. In the JHK bands SNe Ia have their maxima before tB = 0, and they later show secondary maxima around tB = 20 to 30 days (L88). This anomalous behavior in the infrared appears to be caused by a strong unidentified infrared absorption that increases in strength after the time of B maximum (Elias et al 1981, Lynch et al 1990). The high infrared luminosity before B maximum prevents the construction of a reliable bolometric light curve before tB = 5. The mean bolometric light curve for tB = 5 to 110 days was determined by L88 using the UBVJHK light curves. It thus comprises the flux between 3000 Å and 2 µm, which is believed to include practically the entire flux. The bolometric light curve, tabulated by LT92, seems to decline after tB = 5 almost linearly. Extrapolation backwards suggests that the bolometric maximum may occur before tB = 0, perhaps 17-18 days after the explosion.
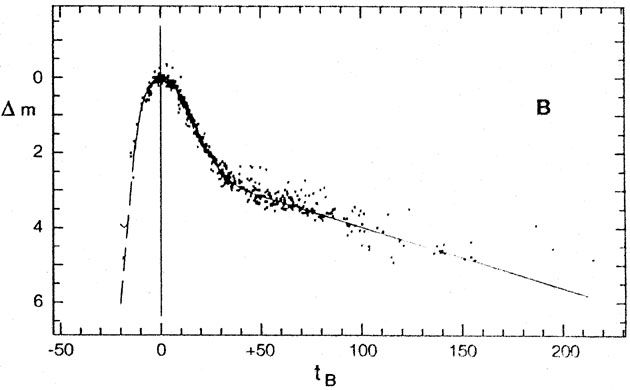
At tB = 5 the B light curve (Figure 2) plunges into a steep decline which teaches 0.12 mag per day at tB = 15 and then flattens again. After 44 days the decline becomes linear at 0.017 mag per day. The linearity of the late blue light curve seems to persist until at least tB = 350 or 400 days. The first plunge in V is slower by a factor of 2, while the plunge in U is slightly steeper and of longer duration, than that in B. The slow linear decline phase of the U and V light curves is reached after 31 and 41 days, respectively, and both are somewhat steeper than in B. Thus at late phases an SN Ia becomes increasingly blue again. It is clear that the shape of the light curve is strongly wavelength dependent.
|
Figure 2. The standard B light curve (adapted from Cadonau 1987), based on observations of 22 SNe Ia. |
The significance of the template light and color curves has been greatly increased by two SNe Ia that were discovered after the templates were defined. The photometry of SN 1989B (M.M. Phillips, unpublished) and SN 1990N (Leibundgut et al 1991b) agrees with the templates to within 0.1 mag.
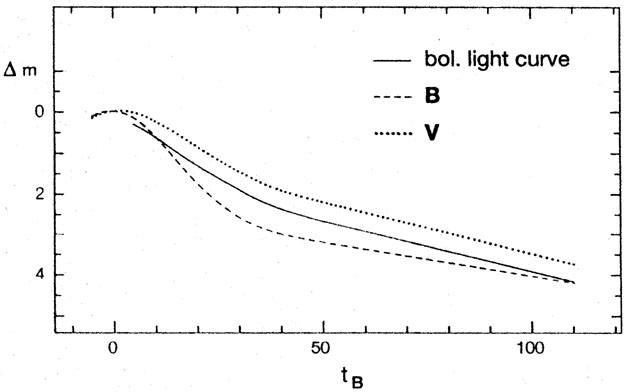
The bolometric light curve (Figure 3) is roughly
linear from tB = 5
to 42 days with an average decline of 0.057 mag per day, corresponding
to a half-life of 13.2 days. After 42 days the perfectly linear
decline rate becomes 0.025 mag per day. The corresponding half-life of
33 days is much shorter than the 77 day half-life of 56Co,
indicating that the leakage of
 rays during the
late phases is important.
rays during the
late phases is important.
|
Figure 3. The standard bolometric light curve (adapted from Leibundgut 1988). |
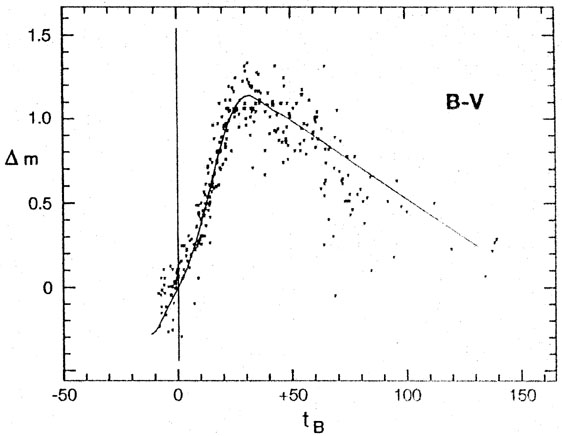
Good definition of the templates in different bands requires, of course, that the color curves also follow a standard behavior. The (B - V) curve, for instance, must simply be the difference between the B and V light curves. The available (B - V) observations of SNe Ia are shown in Figure 4. They follow the expected template quite well up to about tB = 40 days. The much larger scatter at later times may be due to larger observational errors as the supernova becomes fainter.
It should be noted that the zero point of (B - V) in Figure 4 is arbitrary. The individual color curves have been shifted vertically to agree on average with the template. This procedure provides neither a calibration of (B - V) at B maximum nor a proof that all SNe Ia have the same intrinsic color. The observations are consistent with a common intrinsic color evolution, however, and we assume that to be the case.
|
Figure 4. The standard B - V curve. The value of B - V at tB = 0 is arbitrarily plotted at 0.0. The full line is the difference between the standard B and V light curves. |
The value of (B - V)00 at tB = 0 can in principle be determined from the bluest SNe Ia known. [(Here the notation m0 means that the magnitude has been corrected for Galactic extinction following the precepts of the RSA (Sandage & Tammann 1987), and m00 means that the magnitude is also corrected for extinction in the parent galaxy; the analogous notation is used for colors.) Three blue SNe Ia, SN 1970J, SN 1972J, and SN 1974J, all essentially depending on Asiago photometry, give (B - V)00 = -0.2 ± 0.01 (LT92), in good agreement with Pskovskii (1967). However, the value (B - V)00 = -0.15 found by Barbon et al (1973) has been widely used in the literature, and Hamuy et al (1991) have argued quite convincingly, using SN 1980N and SN 1981D, against a very blue color. We therefore adopt the conventional value of (B - V)00 = -0.15.