Copyright © 1992 by Annual Reviews. All rights reserved
| Annu. Rev. Astron. Astrophys. 1992. 30:
359-89 Copyright © 1992 by Annual Reviews. All rights reserved |


2.2 Spectra
Early observers of SNe Ia were justifiably impressed by the spectral homogeneity. Minkowski (1939) presented a long series of photographic spectra of SN 1937C and SN 1937D and stressed the similarity of their spectral evolution. Kirshner et al (1973) presented supernova spectra obtained with a linear detector and emphasized the spectral resemblance of SN 1972E to SN 1937C. Oke & Searle (1974), in their review of all supernova spectra published by that time, found only three SNe I - SN 1954A, SN 1962L, and SN 1964L - to have been significantly peculiar, and all three are now regarded as type Ib or type Ic (Porter & Filippenko 1987, Harkness & Wheeler 1990).
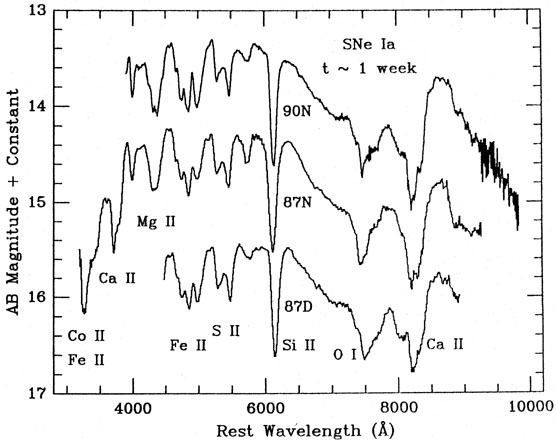
During the early phases near maximum light the SN Ia spectra consist of broad, overlapping P Cygni profiles characteristic of an atmosphere in expansion at velocities on the order of 10,000 km/sec. Identifications are with lines of neutral or singly ionized elements of intermediate mass, e.g. Si II, Ca II, S II, and OI (Pskovskii 1968; Branch et al 1982, 1983). During the first few months after maximum light the spectrum becomes dominated by P Cygni profiles of Fe II (Branch et al 1983), and after hundreds of days it appears to consist mainly of broad overlapping emission lines due to the first few ionization stages of iron (Kirshner & Oke 1975; Meyerott 1978, 1980; Axelrod 1980a, 1980b; Woosley et at 1984). Some direct comparisons of the spectra of a few SNe Ia at the same phase, plotted on a common scale, have been published by Branch (1989), Pearce et al (1988b), Hamuy et al (1991), Ruiz-Lapuente et al (1991), and Filippenko (1991 and Figure 5). The impression one receives is that during the early photospheric phases only minor (but real) differences are present in the strengths of the spectral features. IUE observations of a few SNe Ia also show a strong uniformity in the ultraviolet spectra (Panagia & Gilmozzi 1991). Not many spectra obtained during the late nebular phases have been published yet, but inspection of the available data (e.g. Kirshner & Oke 1975 for SN 1972E, Branch 1990 for SN 1981B, de Robertis & Pinto 1985 for SN 1983U) suggests that the early spectral uniformity persists into the late phases. A (nearly) complete bibliography of supernova spectra up to 1988 has been published (Branch 1990) and is being updated (S. Benetti and D. Branch, in preparation). The present list includes some 70 SNe Ia, almost all of which do not noticeably depart from the standard SN Ia spectral evolution.
|
Figure 5. Spectra of three Type Ia supernovae, SN 1987D, SN 1987N, and SN 1990N, about one week after maximum. (Figure courtesy of Alex Filippenko) |
A strong indication that SNe Ia do, however, show significant
differences in the blueshifts and widths of their spectral features
was provided by SN 1984A. The spectrum of SN 1984A
(Wegner & McMahan
1987)
near maximum light is consistent with a velocity at the
photosphere that was 4300 km s-1 higher than in the more
typical SN 1981B
(Branch 1987).
Pearce et al (1988a)
suggested that the
difference in the expansion velocity might merely be due to a mismatch
in the phases of the two supernovae, but
Branch et al's (1988)
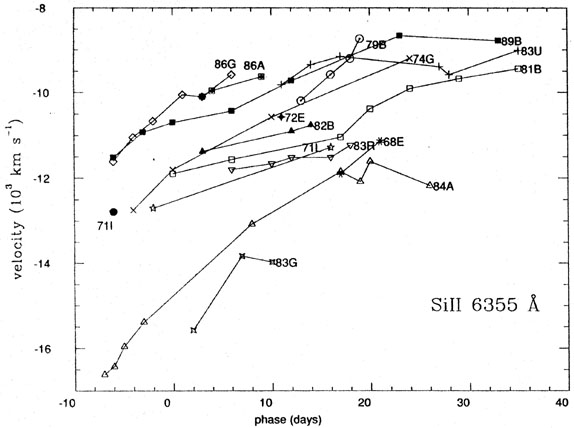
plot of the blueshift of the red Si II
 6355 absorption feature versus phase
showed scatter that was too large to be attributed to errors in
velocity or phase.
Barbon et al (1990)
subsequently published a similar diagram supporting the same conclusion
(Figure 6). Near
maximum light the blueshift of the relatively unblended Si II
absorption ranges from about 10,000 km s-1 in
SN 1986G, SN 1986A, and
SN 1989B to at least 15,000 km s-1 in
SNe 1983G
and SN 1984A.
Barbon et al (1990)
found that a more blended feature in the blue, usually
attributed to Mg II 4481,
shows a smaller scatter in its
velocity-phase diagram; whether this is due to smaller intrinsic
scatter or to the blending is not yet clear. The physical significance
of the velocity differences also is not yet clear. It is possible that
SNe Ia arising from white dwarfs that ignite at various central
densities might have different expansion velocities but similar
absolute magnitudes
(Canal et al 1991).
Alternatively, the observed
differences might be partly due to departures from spherical symmetry
- either large-scale shape asymmetries as have been inferred for
SN 1987A, or small-scale asymmetries associated with
clumping of the ejected matter
(Muller & Arnett 1986).
6355 absorption feature versus phase
showed scatter that was too large to be attributed to errors in
velocity or phase.
Barbon et al (1990)
subsequently published a similar diagram supporting the same conclusion
(Figure 6). Near
maximum light the blueshift of the relatively unblended Si II
absorption ranges from about 10,000 km s-1 in
SN 1986G, SN 1986A, and
SN 1989B to at least 15,000 km s-1 in
SNe 1983G
and SN 1984A.
Barbon et al (1990)
found that a more blended feature in the blue, usually
attributed to Mg II 4481,
shows a smaller scatter in its
velocity-phase diagram; whether this is due to smaller intrinsic
scatter or to the blending is not yet clear. The physical significance
of the velocity differences also is not yet clear. It is possible that
SNe Ia arising from white dwarfs that ignite at various central
densities might have different expansion velocities but similar
absolute magnitudes
(Canal et al 1991).
Alternatively, the observed
differences might be partly due to departures from spherical symmetry
- either large-scale shape asymmetries as have been inferred for
SN 1987A, or small-scale asymmetries associated with
clumping of the ejected matter
(Muller & Arnett 1986).
|
Figure 6. Blueshift of the Si II
|
Differences in the velocities may persist into the late nebular phases. Features in the late spectra of SN 1986G appear to be significantly narrower than in SN 1981B (S. Benetti, private communication). As discussed in the next section, however, SN 1986G showed various other peculiarities, so the question of homogeneity in the late phases should be judged on the basis of more well behaved SNe Ia.