Copyright © 1979 by Annual Reviews. All rights reserved
| Annu. Rev. Astron. Astrophys. 1979. 17:
135-87 Copyright © 1979 by Annual Reviews. All rights reserved |


3.1 Observed Rotation Curves
Roberts (1975a) has dramatically illustrated the difficulty of using the older optical rotation curves to probe the outer mass distributions of spiral galaxies. A convenient measure of the optical extent of a galaxy is the Holmberg radius (Holmberg 1958), which is the major-axis radius at a surface brightness of 26.5 photographic mag arcsec-2. Roberts found that the median extent of optical rotation curves published up to 1975 was only 0.3 Holmberg radii. These curves typically showed a steep rise in rotational velocity near the nucleus, then a short section of leveling off [e.g. NGC 157 (Burbidge et al. 1961)]. There the data ended, usually because the surface brightness of the galaxy was so low that further measurements were impossible.
Until recently it was customary to assume that in such cases the
turnover of the rotation curve had been reached and that the
rotational velocity declined smoothly past the turnover radius,
eventually to reach the Keplerian falloff, V  R-1/2, at large
R. Considerable theoretical machinery was constructed to model the
curve and deduce the mass distribution and total mass from the
measured points.
Burbidge & Burbidge
(1975)
give a comprehensive description of these techniques;
Bosma (1978)
provides a useful additional discussion of
Toomre (1963)
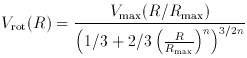
disk models. A simple and commonly used approximation is based on
Brandt's (1960)
parametrization of the rotation curve:
R-1/2, at large
R. Considerable theoretical machinery was constructed to model the
curve and deduce the mass distribution and total mass from the
measured points.
Burbidge & Burbidge
(1975)
give a comprehensive description of these techniques;
Bosma (1978)
provides a useful additional discussion of
Toomre (1963)
disk models. A simple and commonly used approximation is based on
Brandt's (1960)
parametrization of the rotation curve:
where Vmax is the maximum rotational velocity,
Rmax is the radius at
which the maximum rotational velocity occurs, and n is a shape parameter
which determines how rapidly the curve reaches a Keplerian falloff.
The value of n is determined by fitting the curve up to the last
measured point. If it is assumed that the velocity beyond this radius
is adequately approximated by the Brandt model, the total mass of the
galaxy, MT, is (3/2)3/n
V2max Rmax / G.
In the context of extragalactic astronomy a decade ago, the Brandt
model and its relatives were a logical way to model the outer regions
of a galaxy. After all, the light was falling off rapidly at the last
measured point, and in several galaxies the rotation curve also seemed
to be falling appreciably as well [e.g. NGC 5055
(Burbidge et
al. 1960)].
However, workers at that time were well aware that
a convenient extrapolation was being used which might not represent
reality. ``One does not know how much the tail wags the dog,'' cautioned
Burbidge and Burbidge.
Radio 21-cm observations, which in many galaxies now extend well
past the Holmberg radius, do not confirm this extrapolation. The radio
rotation curves remain flat to the limit of observation, in some cases
beyond 50 kpc, indicating much larger total masses than given by the
Brandt formula. This result was strongly hinted at in early
observations by
Shostak & Rogstad
(1973),
Rogstad et al.
(1973,
1974),
and Seielstad &
Wright (1973).
Further evidence came from observations
of M31 by Roberts
(Roberts 1975a,
Roberts & Whitehurst
1975)
and from an early compilation of rotation curves by
Huchtmeier (1975).
These initial results have been overwhelmingly confirmed by the more recent
work of
Bosma (1978),
Krumm, and Salpeter
(Salpeter 1978),
and other
references summarized in Table 1. At the same
time, Rubin, Ford and
co-workers (summarized by
Rubin et al. 1978)
have pushed optical observations to greater radii by exploiting improvements in
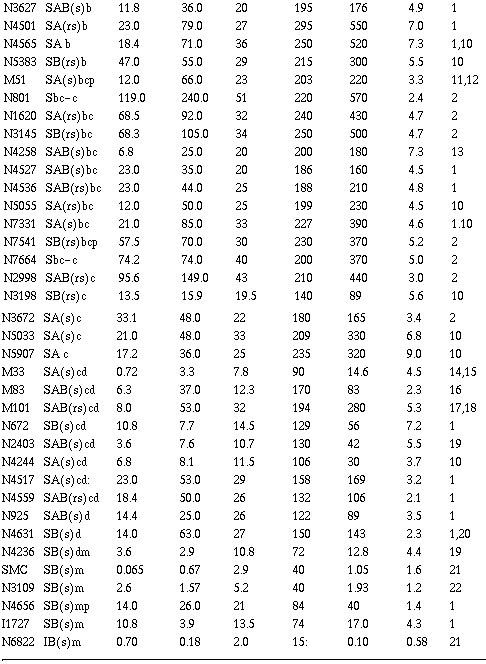
spectrograph and image-tube design. A montage of representative modern
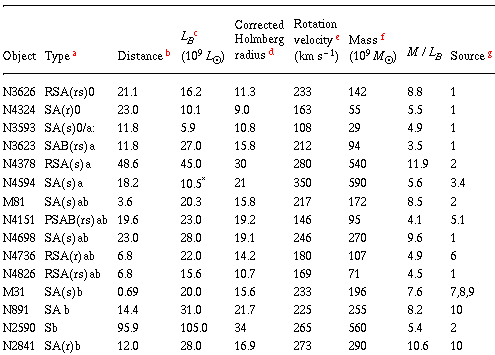
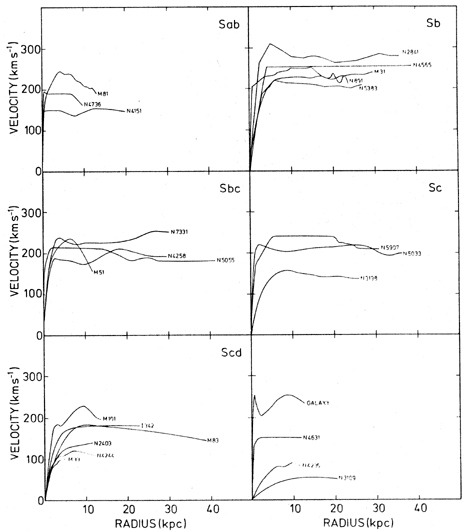
rotation curves collected by Bosma is shown in
Figure 2.
Figure 2. Rotation curves of 25 galaxies of
various morphological types from
Bosma (1978).
There are now approximately 50 galaxies for which reliable rotation
curves exist out to large radii (see Table 1).
Very few are seen to
turn over at all, and only three (M81, M51, and M101) show significant
declines. All three of these galaxies, however, have nearby companions
which may well perturb the outer H I. Furthermore, M81 has a large
bulge which might produce a turnover in velocity because of its strong
central condensation, while the H I in M101 shows strongly asymmetric
motions on opposite sides of the major axis. In short, all three of
these galaxies might well be atypical objects.
The reality of flat rotation curves has been questioned on several
grounds. Doubts have been raised, for example, as to whether the H I
is truly in circular motion. There are indeed good reasons to fear
that within the inner regions of galaxies, ionized gas is not always
in circular orbit. For example, marked asymmetries in the inner
rotation curves amounting to ~ 100 km sec-1 exist in both
M31
(Rubin & Ford 1971,
de Harveng & Pellet
1975)
and M81
(Goad 1976).
Moreover, the emission-line rotation curves of bulge-dominated early-type
spirals do not rise nearly as steeply as the light distributions
suggest they should. The brightness profiles of such bulges near the
nuclei are similar to those of elliptical galaxies
(Kormendy 1977a,
Burstein 1978,
Kormendy & Bruzual
1978),
and by analogy we would
expect the rotation curve to rise to a sharp maximum within a few arc
seconds, provided the mass-to-light ratio is uniform. In the three Sa
galaxies with observed rotation curves, NGC 4378
(Rubin et al. 1978
NGC 4594
(Schweizer 1978),
and NGC 681
(Burbidge, Burbidge
& Prendergast 1965),
this steep rise is not observed. NGC 4594 is an
especially puzzling case; M / LB in the nucleus based
on the velocity dispersion is 12.6
(Williams 1977)
yet is only 0.26 at 1 kpc according to the rotation curve
(Schweizer 1978).
Since the spectrum and colors
(S. Faber, unpublished) give no hint of a significant change in the
mass-to-light ratio of the stellar population, we seriously doubt that
the ionized gas is in circular motion. Einasto (1972) has expressed a
similar opinion that observed velocities in the ionized gas in the
bulge of M31 are too low to reflect true rotation. Lack of adequate
spatial resolution and noncircular motions due to bar-like distortions
(Bosma 1978) are additional complications affecting rotation curves
near nuclei.
For these reasons, rotation curves in the inner regions of galaxies
might not be useful indicators of the mass distribution. We prefer to
concentrate here on the outer regions, where noncircular motions and
lack of angular resolution pose fewer problems. Even at large radii,
however, the interpretation of these observations is a subtle
matter. For example, sidelobes on radio telescopes could produce a
fictitious flat rotation curve due to spillover from the bright HI at
smaller radii. The initial results of Krumm and Salpeter
(Salpeter 1978)
were criticized for this reason by
Sancisi (1978), but
F. Briggs, N. Krumm, and E. Salpeter (in preparation) have since
carefully calibrated the sidelobes of the Arecibo dish, and the final
data should be free from this effect. Moreover, it is hard to see how
sidelobes could affect the entire body of available data, since 21-cm
measurements have been with many different instruments, single dishes
as well as interferometers. The fact that flat rotation curves are
also measured with optical techniques further strengthens this
conclusion.
For all these reasons, it seems most unlikely that flat rotation
curves are merely an artifact of observational errors. Even so,
various dynamical arguments have been advanced which question the
conventional identification with local circular velocity. For example,
the outermost H I layer in many spirals is significantly warped out of
the main plane of the galaxy (e.g.
Rogstad, Lockhart &
Wright 1974,
Sancisi 1976).
These warps might be accompanied by motions which
mimic a flat rotation curve along the major axis if the inclination of
the warp were properly arranged. However, for several of the galaxies
in Table 1, warps have been fully modelled using
the entire
information available in two dimensions, and a flat rotation curve
still persists. Further, the sheer bulk of the data is beginning to
tell: it is hard to see how warps with random projection factors could
conspire to produce a flat rotation curve in so many different galaxies.
It has also been suggested that H I at large radii might represent
recent infall and not yet be in dynamical equilibrium. However, with
few exceptions (e.g. M101) the velocities on opposite sides of the
galaxy are reasonably symmetric, and circular motions (with a possible
warp) satisfactorily fit the observations leaving relatively small residuals
(Bosma 1978).
Furthermore, because the flat portions in many
galaxies extend over a large fraction of the observable radius, one
would be forced to conclude that a large portion of the gas is out of
equilibrium.
In summary, we feel that no generally valid alternative explanation
has been put forward for these flat rotation curves and that the
observations and their implications must therefore be taken very seriously.
For an assumed spherical mass distribution and Vrot
constant with
radius, the mass within radius R increases linearly with radius and
the surface mass density declines as R-1. Since the
surface brightness of spirals declines exponentially
(Freeman 1970,
Schweizer 1976),
this simple model predicts a strong increase in the local mass-to-light
ratio projected on the sky as long as the rotation curve stays flat.
Bosma (1978)
finds that the precise form of this increase depends
rather sensitively on the nature of the mass model assumed, whether
spherical or disk. However, the increase in local M / L cannot be made
to disappear completely by varying the model.
Bosma (1978) and
Roberts & Whitehurst
(1975)
have obtained local values of M / LB of 100-300 in
seven spirals at the outer limits of the observations, much larger
than M / LB for the stellar population in the solar
neighborhood
(Section 2.1).
Despite the complications mentioned above, mass determination using
rotation curves is a relatively simple procedure. There are none of
the statistical projection factors and group membership decisions
which plague the analysis of binary and group motions. Based on
present data and standard interpretations, it seems relatively certain
that dark material is being detected.
The amount of extra mass actually implied by these rotation curves
is itself relatively trivial; galaxy masses on average have perhaps
doubled over the older optical estimates, not enough to satisfy the
mass discrepancy for groups and clusters, as we shall
see. Nevertheless, flat rotation curves have profound implications for
the problem of missing mass, first because the detection of unseen
matter is relatively secure and second because at least some of the
missing mass seems to be associated with individual galaxies
themselves.