Copyright © 1994 by Annual Reviews. All rights reserved
| Annu. Rev. Astron. Astrophys. 1994. 32:
277-318 Copyright © 1994 by Annual Reviews. All rights reserved |


2.1 X-Ray Imaging Evidence for Cooling Flows
A sharply peaked X-ray surface brightness distribution is indicative of a cooling flow, because it shows that the gas density is rising steeply towards the center of the cluster or group. Since the observed surface brightness depends upon the square of the gas density and only weakly on the temperature, this result is not model dependent. The high central density indicates a short cooling time.
Most of the images have been obtained with the Einstein Observatory, EXOSAT, and ROSAT, although the peaked X-ray surface brightness was anticipated with data from the Copernicus satellite (Fabian et al 1974, Mitchell et al 1975), from rocket-borne telescopes (Gorenstein et al 1977), and from the modulation collimators on SAS 3 (Helmken et al 1978).
The fraction of clusters with high central surface brightness is large, which means that cooling flows must be both common and long-lived. More than 30 to 50% of the clusters well-detected with the Einstein Observatory (Stewart et al 1984b, Arnaud 1988) have surface brightnesses that imply tcool < H0-1 within the central 100 kpc or so. This fraction is certainly an underestimate, because the ~ 1' angular resolution of the images dilutes the central surface brightness. Additional data from EXOSAT (Edge & Stewart 1991a, b) show that more than two thirds of the 50 X-ray brightest clusters in the sky (see list in Lahav et al 1989) have cooling flows (Edge et al 1992). Since this last sample (Table 1) is based on the total flux, to which the cooling, flow makes only a minor contribution, the high fraction is not a selection effect. This fraction is also an underestimate, since many of the remaining clusters in the sample have not been imaged; thus their status is undefined. Whether H0-1 should be used for ta is debatable, but inspection of the results shows that reducing ta by 2, say, does not much change the fraction of clusters containing cooling flows. The overall picture is that the prime criterion for a cooling flow, tcool < 1010 yr, is satisfied in a large fraction (~ 70-80%) of clusters. It is also satisfied in a number of poor clusters and groups (Schwartz et al 1980, Canizares et al 1983, Singh et al 1986, 1988, Schwartz et al 1991, Mulchaey et al 1993, Ponman & Bertram 1993). Cooling flow conditions also occur in large, isolated elliptical galaxies (Nulsen et al 1984, Canizares et al 1987). The largest catalogue of cooling flows to date is by White (1992) who has analyzed the images of most clusters observed with the Einstein Observatory (the selection criteria used for such observations means that this sample is not complete in the statistical sense).
| Central | Bin | Mass Flow | ||||||
| Cooling Time | Size | Rate | ||||||
| Cluster | Redshift | O | R | Fluxb | LXc | (109 yr) | (kpc) | (M yr-1) yr-1)
|
| A426 | 0.0183 | 
| | 75.0 | 110 | 0.48±0.02 | 31 I | 183 |
| Ophiuchus | 0.028 | - | - | 44.5 | 152 | 3.1±7.4 | 29 L | 75 |
| Coma | 0.0232 | x | 0 | 32.0 | 75 | 95±239 | 47 I | 0* |
| Virgo | 18 Mpc |
| | 30.0 | 1 | 0.03±0.01 | 3 L | 10 |
| A2319 | 0.0564 | x | x | 12.1 | 170 | 13.1±2.2 | 73 I | 66 |
| A3571 | 0.0391 | - | - | 11.5 | 77 | 7.8±12.9 | 35 L | 79 |
| Centaurus | 0.0109 |
| | 11.2 | 6 | 0.49±0.10 | 10 L | 18 |
| Tri. Aust. | 0.051 |
| | 11.0 | 126 | 65±254 | 160 L | 0 |
| 3C129 | 0.022 | - | | 9.59 | 20 | 5.1±4.5 | 44 L | 61 |
| AWM7 | 0.0172 | x | - | 9.14 | 12 | 3.9±1.2 | 65 I | 42 |
| A754 | 0.0542 | x | x | 8.53 | 105 | 9.5±12.5 | 48 L | 24 |
| A2029 | 0.0767 | x | | 7.52 | 197 | 3.8±0.7 | 99 I | 402 |
| A2142 | 0.0899 | x | - | 7.50 | 272 | 3.0±0.8 | 48 H | 188 |
| A2199 | 0.0300 |
| | 7.12 | 30 | 2.4±1.8 | 42 L | 150 |
| A3667 | 0.0530 | x | - | 6.68 | 83 | 165±236 | 112 I | 0* |
| A478 | 0.0882 |
| | 6.63 | 241 | 2.3±0.5 | 70 L | 570 |
| A85 | 0.0521 |
| | 6.37 | 75 | 3.8±0.6 | 69 I | 236 |
| A3266 | 0.0594 | x | | 5.90 | 92 | 21.5±17.3 | 70 H | 10 |
| A401 | 0.0748 | x | x | 5.88 | 147 | 20.1±5.9 | 92 I | 12 |
| 0745-191 | 0.1028 |
| | 5.87 | 280 | 2.1±0.5 | 32 L | 702 |
| A496 | 0.0330 |
| | 5.67 | 25 | 2.1±0.3 | 43 I | 112 |
| A1795 | 0.0627 |
| | 5.30 | 89 | 2.5±0.4 | 81 I | 478 |
| A2256 | 0.0581 | x | 0 | 5.20 | 83 | 175±38 | 153 I | 0* |
| Cygnus-A | 0.057 |
| | 4.78 | 69 | 4.2±0.5 | 92 I | 187 |
| 2A0335+096 | 0.0349 |
| | 4.67 | 25 | 0.90±0.11 | 35 L | 142 |
| A1060 | 0.0124 | | x | 4.36 | 2 | 2.2±3.3 | 16 L | 9 |
| A3558 | 0.0478 | x | - | 4.21 | 42 | - | - | 50 |
| A644 | 0.0704 | x | x | 4.15 | 92 | 8.7±1.1 | 146 I | 326 |
| A1651 | 0.0846 | x | - | 3.67 | 112 | - | - | - |
| A3562 | 0.0499 | x | - | 3.52 | 39 | 4.5±4.8 | 25 L | 45 |
| A1367 | 0.0215 | x | 0 | 3.45 | 7 | 21.5±3.7 | 92 I | 0 |
| A399 | 0.0715 | x | x | 3.41 | 78 | 25.4±5.0 | 139 I | 0 |
| A2147 | 0.0356 | - | | 3.28 | 18 | 15.2±24.5 | 83 L | 54 |
| A119 | 0.0440 | x | - | 3.03 | 26 | 14.6±9.3 | 86 L | 23 |
| A3158 | 0.0590 | x | - | 2.99 | 46 | 23.2±3.8 | 197 I | 0 |
| Hydra-A | 0.0522 |
| | 2.90 | 35 | 1.8±0.7 | 50 L | 315 |
| A2052 | 0.0348 |
| | 2.66 | 14 | 1.1±0.2 | 40 L | 90 |
| A2063 | 0.0350 | x | | 2.64 | 13 | 4.1±1.0 | 68 I | 45 |
| A1644 | 0.0474 | x | - | 2.60 | 24 | 13.5±4.6 | 59 I | 19 |
| A2065 | 0.0721 | - | - | 2.79 | 65 | 33.3±8.2 | 136 I | 0 |
| Klemola44 | 0.0283 | - | - | 2.55 | 9 | - | - | - |
| A262 | 0.0164 |
| | 2.35 | 3 | 0.87±0.40 | 23 I | 47 |
| A2204 | 0.1523 | - | - | 2.20 | 235 | - | - | - |
| A2597 | 0.0824 |
| | 2.90 | 64 | 11.1±2.0 | 185 I | 480 |
| A1650 | 0.0845 | - | x | 2.07 | 66 | 54±103 | 160 I | 0 |
| A3112 | 0.0746 | x | - | 1.95 | 48 | 2.1±1.0 | 82 L | 430 |
| A3532 | 0.0585 | - | - | 1.95 | 30 | 44.1±14.9 | 141 I | 0 |
| A4059 | 0.0478 | | - | 1.88 | 19 | 3.5±8.5 | 35 L | 124 |
| A3391 | 0.0545 | x | - | 1.79 | 23 | 31.8±5.7 | 140 I | 0 |
| MKW3s | 0.0449 |
| | 1.79 | 15 | 4.0±0.9 | 77 I | 151 |
| A1689 | 0.181 | x | - | 1.75 | 268 | 13.8±2.3 | 190 I | 164 |
| A576 | 0.0381 | x | | 1.72 | 11 | 15.1±3.3 77 I 6 | ||
| A2244 | 0.1024 | - | x | 1.71 | 81 | 12.2±2.0 | 120 I | 82 |
| A2255 | 0.0809 | x | - | 1.71 | 49 | 143±268 | 97 I | 0* |
| A1736 | 0.046 | x | - | 1.70 | 16 | 32.9±7.5 | 115 I | 0 |
a From
Edge et al (1992).
A dash in
any column means that the
information is not available. The statistical uncertainty in the
estimate of M is typically about 20%; the systematic uncertainty,
given errors on the gravitational potential in the core of a cluster,
may be up to a factor of 2. Whether a (focused) cooling flow exists or
not can be judged from the estimates of the central cooling time,
which should be less than about 1010 yr for a flow. The cooling time
depends on the size of the innermost bin used in analyzing the cluster
image, which in turn depends on the signal-to-noise of the data, the
distance to the cluster, and the resolution of the instrument (I for
IPC, H for HRI, L for CMA). As discussed by Edge et al, an estimate of
the cooling time of the gas within art image bin depends directly on
the size of that bin (strongly if a cooling flow is present). Those
clusters where the bin size is larger than about 100 kpc and
| ||||||||
|
b 2-10 keV flux in units of 10-11 erg cm-2 s-1. | ||||||||
|
c 2-10 keV luminosity in units of 1043 h50-2 erg s-1. | ||||||||
|
Asterisks in the final column indicate those clusters where there is no focused cooling flow taking place. A tick in the O column means optical line emission is detected, a tick in the R column means radio emission is detected from the central galaxy (Ball et al 1993 and references therein). | ||||||||
The mass deposition rate,  , due
to cooling (i.e. the accretion
rate, although this is a poor term since most of the gas does not flow
in far from rcool) can be estimated from the X-ray
images by using the
luminosity associated with the cooling region (i.e.
Lcool within rcool)
and assuming that it is all due to the radiation of the thermal energy
of the gas, plus the PdV work done on the gas as it enters
rcool:
, due
to cooling (i.e. the accretion
rate, although this is a poor term since most of the gas does not flow
in far from rcool) can be estimated from the X-ray
images by using the
luminosity associated with the cooling region (i.e.
Lcool within rcool)
and assuming that it is all due to the radiation of the thermal energy
of the gas, plus the PdV work done on the gas as it enters
rcool:
where T is the temperature of the gas at rcool.
Lcool is similar (but
not identical) to the central excess luminosity defined by
Jones & Forman (1984);
it ranges from ~ 1042 to > 1044 erg
s-1 and generally
represents ~ 10% of the total cluster luminosity. Values of
Figure 2. Properties of the ICM in
A478
obtained by deprojecting the
ROSAT HRI and PSPC images (small and larger bins, respectively) and
solving for the density and temperature
(White et al 1994,
Allen et al 1994).
The dotted line on the temperature plot indicates the mean
temperature determined from the Ginga broad-beam spectrum
(Johnstone et al
1992).
Note that the cooling time of the gas is less than
1010 yr at 200 kpc.
Since we often measure an X-ray surface brightness profile for the
cluster core (where the X-ray emission is well-resolved), we have
Lcool(r) which can be turned into
This means that the gas must be inhomogeneous, so that some of the gas
cools out of the hot flow at large radii and some continues to flow
inward.
The actual computation of
The ROSAT High Resolution Imager (HRI) shows that the X-ray surface
brightness profile in most clusters continues to rise inward
(Figure 1) to within the inner 10 kpc. In
A478,
the cooling time is seen to
drop below 4 x 10⁸ yr at that radius and the total mass deposition
rate
Figure 1. 3-dimensional representation of
the X-ray surface brightness
of the A478 cluster as seen by the ROSAT HRI
(White et al 1994).
The
pixel size is 24 arcsec which corresponds to about 60 kpc. The cooling
flow extends so at least 200 kpc radius, incorporating most of the
prominent peak in the figure. Much of the cluster emission lies beyond
the 1.3 x 1.3 Mpc area shown here.
In the case of the Perseus cluster, the cooling flow peaks away from
the nucleus of the central galaxy NGC 1275, in an arc about 15 kpc
away (Figure 3 from
Böhringer et al
1993).
The radio source in the
galaxy appears to be holding off the flow and creating two regions of
low X-ray surface brightness either side of the nucleus, coincident
with the radio lobes. A similar effect is seen in the tails of the
radio lobes of Cygnus A
(Harris et al 1994).
Sarazin et al
(1992a,
b)
have claimed the detection of X-ray filaments in HRI observations of
the flows in A2029 and 2A0335+096. Although the central structure in
2A0335+096 is convincing, the filamentary structures in A2029 were not
found to be significant in a re-analysis of the same image by
White et al (1994).
They may be artifacts of the small ellipticity of the
emission since spurious features can appear significant if it is
assumed that the underlying emission has circular symmetry. A linear
structure identified as a cooling wake is seen in a PSPC image of the
NGC 5044 group
(David et al 1994).
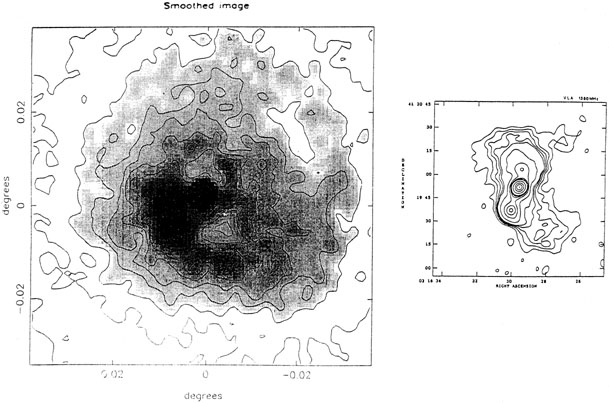
Figure 3. ROSAT HRI image of the central
130 x 130 kpc region of the
Perseus cluster around NGC 1275
(Böhringer et
al 1993).
The radio image from
Pedlar et al (1990)
is shown at the right (to the same
scale): the nuclei in both pictures superpose directly to show that
the outer radio lobes fit in the X-ray dips N and S of the
nucleus. The brightest X-ray patch lies about 15-20 kpc SE from the
nucleus and does not correspond to features seen at other wavelengths,
except that it may be the cause of the bend in the S radio lobe (note
the radio contours) and lies just beyond the optical "blue loop" (see
the figure in
Sandage 1971).
 = 50-100
M
yr-1 are fairly typical for cluster cooling flows. Some
clusters show
= 50-100
M
yr-1 are fairly typical for cluster cooling flows. Some
clusters show
 500
M
yr-1 (e.g. A478, PKS0745, A1795, A2597, A2029, and
Hydra A). The main uncertainties in the determination of
lie in the
gravitational contribution to Lcool and the
appropriate choice for ta.
Assuming ta ~ 1010 yr, the estimates of
are probably accurate to
within a factor of 2
(Arnaud 1988).
Empirically, we find that the
deduced is roughly proportional
to ta1/3 (see
Figure 2), which means
that reducing ta to 109 yr introduces only
a factor ~ 2 reduction in
.
500
M
yr-1 (e.g. A478, PKS0745, A1795, A2597, A2029, and
Hydra A). The main uncertainties in the determination of
lie in the
gravitational contribution to Lcool and the
appropriate choice for ta.
Assuming ta ~ 1010 yr, the estimates of
are probably accurate to
within a factor of 2
(Arnaud 1988).
Empirically, we find that the
deduced is roughly proportional
to ta1/3 (see
Figure 2), which means
that reducing ta to 109 yr introduces only
a factor ~ 2 reduction in
.

rises with radius to about
600-800 M
yr-1.
(r), the integral mass deposition
rate within radius r. Generally, the surface brightness profiles are
less peaked than they would be if all the gas were to flow to the
center, giving roughly
 (r) is complicated, since
we need to take
into account how the gas cools and any gravitational work done on it.
The thermal energy of the gas is generally more important than
gravitational energy release in clusters (Tgas is
several times
greater than the virial temperature of the central galaxy), so a
simple analysis gives a fair approximation to the profile (see
Fabian et al 1986;
Thomas et al 1987;
White & Sarazin 1987a,
b,
c,
1988).
Even if clusters have small core radii (say < 100 kpc), thereby
significantly reducing Lcool, then the fraction with
cooling flows
would not be more than halved. In the case of
A478, a comparison of
the temperature decrease observed in the ROSAT Position Sensitive
Proportional Counter (PSPC) spectrum with that inferred from the image
shows that the core radius in that rich cluster is not small, and must
exceed 200 kpc
(Allen et al 1993).
(r) is complicated, since
we need to take
into account how the gas cools and any gravitational work done on it.
The thermal energy of the gas is generally more important than
gravitational energy release in clusters (Tgas is
several times
greater than the virial temperature of the central galaxy), so a
simple analysis gives a fair approximation to the profile (see
Fabian et al 1986;
Thomas et al 1987;
White & Sarazin 1987a,
b,
c,
1988).
Even if clusters have small core radii (say < 100 kpc), thereby
significantly reducing Lcool, then the fraction with
cooling flows
would not be more than halved. In the case of
A478, a comparison of
the temperature decrease observed in the ROSAT Position Sensitive
Proportional Counter (PSPC) spectrum with that inferred from the image
shows that the core radius in that rich cluster is not small, and must
exceed 200 kpc
(Allen et al 1993).
 800
M
yr-1 (Figure 2 taken from
White et al 1994).
800
M
yr-1 (Figure 2 taken from
White et al 1994).