Copyright © 1994 by Annual Reviews. All rights reserved
| Annu. Rev. Astron. Astrophys. 1994. 32:
277-318 Copyright © 1994 by Annual Reviews. All rights reserved |


2.2 X-Ray Spectral Evidence for Cooling Flows
Key evidence that the gas actually does cool to lower temperatures than inferred from the X-ray images, is given by moderate to high resolution spectra of the cluster cores, Canizares et al (1979, 1982), Canizares (1981), Mushotzky et al (1981), and Lea et al (1982) used the Focal Plane Crystal Spectrometer (FPCS) and the Solid State Spectrometer (SSS) on the Einstein Observatory to show that there are low temperature components in the Perseus and Virgo clusters, consistent with the existence of cooling flows. Detailed examination of the line fluxes and of the emission measures of the cooler gas by Canizares et al (1988) and Mushotzky & Szymkowiak (1988) shows that, in the case of the Perseus cluster, the gas loses at least 90% of its thermal energy and that the mass deposition rates are in agreement with those obtained from the images. Good agreement is obtained also in several other clusters. The SSS and FPCS results for M87 show that the emission measure varies with temperature in the manner expected from a cooling gas. The spectral evidence generally contradicts alternative explanations in which the observed radiative cooling is balanced by some heat source.
The cooling time of the gas in the Perseus cluster which emits the
FeXVII line (T < 5 x 10⁶ K) is less than 3 x
107 yr. Since the
emission measure of this gas agrees with that inferred from the gas
cooling at the higher temperatures that dominate the images and the
SSS result, we conclude that the flow is steady and long-lived,
i.e. ta  H-1
(Nulsen 1988).
The shape of the continuum, and line
spectrum observed with the SSS is consistent with the same mass
deposition rate at all X-ray temperatures, further supporting this
conclusion. Cooling flows cannot be some intermittent or transient
phenomenon only a billion years old.
H-1
(Nulsen 1988).
The shape of the continuum, and line
spectrum observed with the SSS is consistent with the same mass
deposition rate at all X-ray temperatures, further supporting this
conclusion. Cooling flows cannot be some intermittent or transient
phenomenon only a billion years old.
An important development has been the discovery of excess X-ray absorption in several cooling flows. This has arisen from spectral analysis of Ginga and the Einstein Observatory SSS data, particularly of A478 (White et al 1991, Johnstone et al 1992). The strong cooling flow in that cluster found from images should have led to an excess of soft emission detectable in the Ginga spectrum even above 2 keV. No such excess was apparent. Instead the SSS data showed X-ray absorption of the cooling flow, which considerably weakened the emergent soft excess. Excess absorption was required for good spectral fits to be obtained for many other cooling flows. The effect is one of line and continuum absorption and could not be explained by an increase in line emission (White et al 1991). To obtain fits to SSS data requires inclusion of a model for the ice that built up on the detector window, and was periodically removed by heating. Spectral fits to SSS data from active galaxies, for example, do not require excess absorption to be included for the objects themselves, so there is reasonable confidence that the values added to the cluster spectra represent absorbing material intrinsic to the clusters, although the precise values for the column density of absorbing matter have a large uncertainty.
Later data from the Broad Band X-ray Telescope (BBXRT) on the ASTRO-I mission confirm the need for excess X-ray absorption for several clusters (K. Arnaud et al 1992, Mushotzky 1992). The data for the Perseus cluster also show that the emission measure of the cooling component builds up towards the center of the flow in the manner expected from distributed mass deposition.
High-quality images from ROSAT pointed observations reveal the X-ray
structure and spectra of cooling flows in new detail. Observations
with the PSPC show that the gas temperature drops progressively inward
within the cooling flow, with a gradient consistent with the results
obtained from simple deprojection analyses (e.g.
Schwarz et al 1992,
Allen et al 1993,
Allen & Fabian 1994).
In the Centaurus cluster the
temperature drops from the cluster mean of 3.5 keV to about 1 keV or
less at the smallest radii measured. In the case of the massive flow
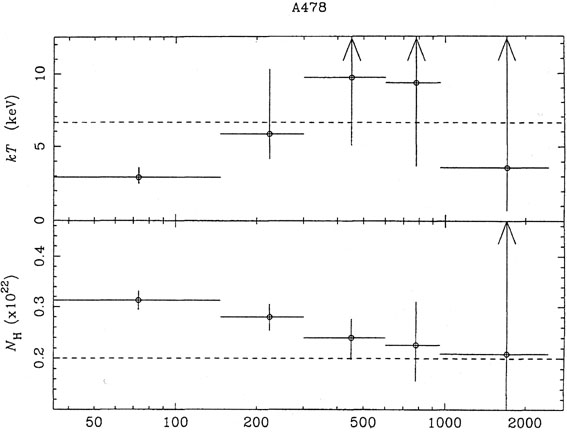
in A478, the temperature drops from the cluster mean of
kT = 6.8 keV
at 300 kpc to below 3 keV within 50 kpc
(Figure 4). At the same time
the absorbing column density required for a good fit to the data
increases to more than 1021 cm-2 above the value
required at outer
radii. Note that such a column density spread over a radius of 100 kpc
implies a total mass exceeding 1011
M , assuming
solar abundance
ratios (the principal absorber in the PSPC band observed is
oxygen). Simple considerations of the enormous emission expected if
the absorber material were at intermediate temperatures
(eg. 102-107
K) strongly indicates that it is very cold
(White et al 1991).
, assuming
solar abundance
ratios (the principal absorber in the PSPC band observed is
oxygen). Simple considerations of the enormous emission expected if
the absorber material were at intermediate temperatures
(eg. 102-107
K) strongly indicates that it is very cold
(White et al 1991).
|
Figure 4. Gas temperature and column density measured as a function of radius from the ROSAT PSPC data of A478 (Allen et al 1993). The innermost gas in the cluster has clearly cooled well below the mean temperature obtained from the Ginga broad-beam spectrum (dashed line; Johnstone et al 1992). Excess absorption, corresponding to at least an extra 1021 cm-2, is apparent in the central area. |
Preliminary analysis of ASCA data on cooling flow clusters shows
both the need for cooler spectral components in the cores and some
excess absorption (Figure 5; Fabian et al, in
preparation). The
spectra are, however, sufficiently complex, as are any realistic
models (with distributed absorption and possible nonsolar metal
abundances), that uncertainties in the precise temperature
distribution within the gas remain. Reasonably good agreement with the
data is found if an absorbed cooling spectrum plus an isothermal
spectrum (to represent the outer gas projected along the line of
sight) are fitted to the data. The cooling flow spectrum is obtained
by summing isothermal plasma models (such as those of
Raymond & Smith
1977 or
Mewe & Gronenschild
1981)
inversely weighted by the cooling function at that temperature,
 (T). To see this, we
recall (see e.g.
Johnstone et al 1992)
that as gas cools at constant pressure from
T to T - dT by emission of radiation, the bolometric
luminosity is given by
(T). To see this, we
recall (see e.g.
Johnstone et al 1992)
that as gas cools at constant pressure from
T to T - dT by emission of radiation, the bolometric
luminosity is given by
where
The result is independent of the geometry. Such models are readily
available in the spectral-fitting package XSPEC
(Shafer et al
1991). See
Wise & Sarazin (1993)
for more complex cooling flow spectral models.
The presence of a cooling flow also appears to influence the overall
spectrum of the cluster, as observed with broad-beam instruments such
as were on EXOSAT, the Einstein Observatory, and
Ginga. Such spectra
enable the total cluster luminosity (LX) and its
(emission-weighted)
mean temperature (TX) and metallicity (Z) to be
determined with good
accuracy. Correlations of LX) and Z vs
(TX) show a significant
nonstatistical scatter. Trends are seen in the correlations if the
clusters are divided on central gas density
(Edge & Stewart 1991a)
or mass cooling rate,
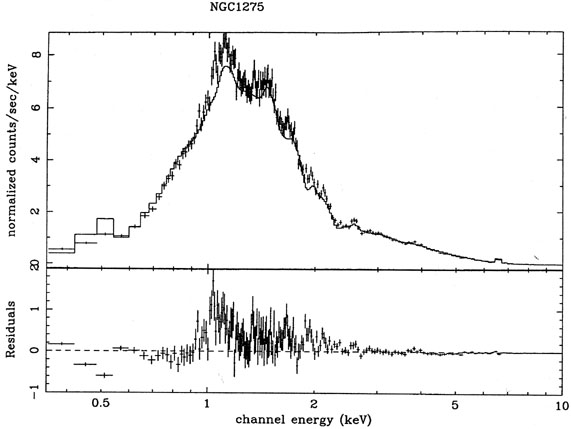
Figure 5. The spectrum of the inner core of
the Perseus cluster (data
points in the upper panel) from the CCD detectors on the Japanese -
U.S. satellite ASCA. The residuals shown here (lower panel) are from
the isothermal plasma model (shown as a solid line in the upper panel)
which best fits the data above 2.5 keV. The temperature of the model
gas is 3.65 keV, significantly less than the best-fitting Ginga value
of 6.3 keV
(Allen et al 1992b).
Note that the residuals are mostly
positive in the 0.9-2.5 keV band and negative from 0.4-0.9 keV. The
positive residuals indicate more soft emission, the negative ones that
excess absorption is required (absorption appropriate to the Galactic
column density is included in the fit). A cooling flow spectrum (from
> 4 KeV) of ~ 370
 (T) is the
cooling function (see e.g.
Raymond & Smith 1977).
But since d Lcool(
(T) is the
cooling function (see e.g.
Raymond & Smith 1977).
But since d Lcool( ) = nenH
 (T)dV, where
(T) is the spectral
emissivity of the gas, then the cooling spectrum
(T)dV, where
(T) is the spectral
emissivity of the gas, then the cooling spectrum
 ,
(Yamashita 1992,
Fabian et al 1994b)
such that
strong cooling flow clusters have a systematically higher luminosity
and higher metallicity at a given temperature. The extent of the
differences required to cause this effect is larger than can be
explained by the cooling flow alone, and means that the whole cluster
is in some way involved.
Fabian et al (1994b)
suggest that it could be
due to widespread inhomogeneity of the intracluster medium, such as is
necessary for producing the distributed mass deposition in the cooling
flows. In other words, the intracluster medium can consist of a range
of densities and temperatures all in pressure equilibrium. This would
not be detectable in even the best individual spectra from broad-beam
instruments
(Allen et al 1992b).
,
(Yamashita 1992,
Fabian et al 1994b)
such that
strong cooling flow clusters have a systematically higher luminosity
and higher metallicity at a given temperature. The extent of the
differences required to cause this effect is larger than can be
explained by the cooling flow alone, and means that the whole cluster
is in some way involved.
Fabian et al (1994b)
suggest that it could be
due to widespread inhomogeneity of the intracluster medium, such as is
necessary for producing the distributed mass deposition in the cooling
flows. In other words, the intracluster medium can consist of a range
of densities and temperatures all in pressure equilibrium. This would
not be detectable in even the best individual spectra from broad-beam
instruments
(Allen et al 1992b).
yr plus hot
isothermal emission, gives a good
overall fit to the data, provided that the cooling flow is absorbed by
 ~ 2.8 x 10²¹
cm-2.
~ 2.8 x 10²¹
cm-2.