Copyright © 1994 by Annual Reviews. All rights reserved
| Annu. Rev. Astron. Astrophys. 1994. 32:
277-318 Copyright © 1994 by Annual Reviews. All rights reserved |


3.1 Optical Data
In the optical waveband there is little direct evidence for cooling
flows. If the cooling gas recombines only once then the expected line
emission, which is spread out over several 100 kpc, would be
undetectable. The central regions of flows, however, often do show
optical-line nebulosity
(Kent & Sargent 1979,
Ford & Butcher 1979,
Heckman 1981,
Fabian et al 1981,
Cowie et al 1983,
Hu et al 1985,
Johnstone et al 1987,
Heckman et al 1989,
Baum 1992,
Crawford & Fabian 1992)
which can be extensive (up to 10 kpc) and luminous (above 1043
erg s-1 in H ) in a
few cases. The emission-line spectra are
characteristic of low-ionization plasmas with strong forbidden
lines. The line widths indicate motions of up to a few 100 km
s-1.
Heckman et al (1989)
classified the nebulosities into Types I and
II according to the ionization state of the gas (e.g. whether the
[NII]
) in a
few cases. The emission-line spectra are
characteristic of low-ionization plasmas with strong forbidden
lines. The line widths indicate motions of up to a few 100 km
s-1.
Heckman et al (1989)
classified the nebulosities into Types I and
II according to the ionization state of the gas (e.g. whether the
[NII]  6584 line is stronger
or weaker than
H, respectively). The
Type I objects tend to be associated with lower
6584 line is stronger
or weaker than
H, respectively). The
Type I objects tend to be associated with lower
 , whereas the type II
objects tend to be in the more X-ray luminous and richer clusters. A
more continuous progression of properties is now recognized
(Crawford & Fabian
1992,
Allen et al 1992a,
Crawford et al 1994).
The central
galaxy in the cluster Sersic 159-03, for example, shows patches of
nebulosity with both types of ionization.
, whereas the type II
objects tend to be in the more X-ray luminous and richer clusters. A
more continuous progression of properties is now recognized
(Crawford & Fabian
1992,
Allen et al 1992a,
Crawford et al 1994).
The central
galaxy in the cluster Sersic 159-03, for example, shows patches of
nebulosity with both types of ionization.
The H emission in the nebulae,
if due to recombination, would imply
that each atom recombines ~ 100-10,000 times. In the more luminous
objects such as NGC 1275 in the Perseus cluster the total luminosity
in UV and optical line emission (assuming it to be at least 30 times
the H luminosity) is greater
than 3 x 1044 erg s-1. Such power is
equivalent to the thermal energy content of the inner part of the flow
around the nebulosity being released on a sound crossing time. Most of
the observed nebulae are one to two orders of magnitude less luminous
than this and some massive flows (e.g. A2029) show no detectable line
emission. The emission-line nebulae are common in central galaxies
with radio sources but are over-luminous when compared with radio
galaxies of the same power that are not in clusters
(Baum 1992).
They are linked to the cooling flow but are not a necessary product of it.
The mass of ionized gas is small (<<108
M ) compared
with the X-ray
absorbing gas and the distribution of the emission is much more
tightly peaked to the center of the flow
(Heckman et al 1989)
than that of the matter dropped by the flow itself. Studies of the source
of ionization of the nebulae show that it must be distributed and is
not, for example, due to a central active nucleus
(Johnstone & Fabian
1988,
Baum 1992).
More plausibly, the nebulae are powered by the
energy of the hot gas, or its turbulence (the emission lines often
show a velocity spread of several 100 km s-1). The spectrum of the
cooling gas is flat enough to create the Type I nebulae
(Voit & Donahue 1990,
Donahue & Voit 1991)
but does not have the required power.
Crawford & Fabian
(1992)
solve this problem using self-absorbed mixing layers
(Begelman & Fabian
1990)
produced as the surfaces of
cold clouds embedded in the hot cooling gas are churned up by
turbulence. The Type II nebulae are explained by the addition of the
emission from shocks as the very dense clouds collide in flows where
the central cloud density and turbulence are high. Shocks also explain
the extended [FeII) emission observed around NGC 1275
(Rudy et al 1993).
) compared
with the X-ray
absorbing gas and the distribution of the emission is much more
tightly peaked to the center of the flow
(Heckman et al 1989)
than that of the matter dropped by the flow itself. Studies of the source
of ionization of the nebulae show that it must be distributed and is
not, for example, due to a central active nucleus
(Johnstone & Fabian
1988,
Baum 1992).
More plausibly, the nebulae are powered by the
energy of the hot gas, or its turbulence (the emission lines often
show a velocity spread of several 100 km s-1). The spectrum of the
cooling gas is flat enough to create the Type I nebulae
(Voit & Donahue 1990,
Donahue & Voit 1991)
but does not have the required power.
Crawford & Fabian
(1992)
solve this problem using self-absorbed mixing layers
(Begelman & Fabian
1990)
produced as the surfaces of
cold clouds embedded in the hot cooling gas are churned up by
turbulence. The Type II nebulae are explained by the addition of the
emission from shocks as the very dense clouds collide in flows where
the central cloud density and turbulence are high. Shocks also explain
the extended [FeII) emission observed around NGC 1275
(Rudy et al 1993).
The optical spectra do give one piece of direct evidence confirming the dense environment. The [SII] optical emission lines are density-sensitive. The pressures derived from the relative strength of the lines in the inner few kpc of several cooling flows are P = nT ~ 106-107 cm-3 K, which is in good accord with values expected from the cooling flow (Johnstone & Fabian 1988, Heckman et al 1989). Such pressures are at least 1000 times higher than those in our own interstellar medium and require an extensive cooling atmosphere around the central galaxy.
Many of the massive cooling flows also show a blue optical
continuum, spatially extended over the central few kpc, in excess of
that expected from the underlying old galaxy. In the case of NGC 1275
this emission is clearly from A (or late B) stars since strong Balmer
absorption lines can be seen
(Rubin et al 1977).
IUE spectra of this
region do however limit the total formation rate of massive stars to
less than about 6
M
yr-1
(Fabian et al 1984a,
Norgaard-Nielsen et
al 1990).
The amount of blue light correlates with the Balmer emission
line luminosity
(Johnstone et al 1987,
Allen et al 1992a,
Crawford & Fabian
1993b,
Crawford et al 1994).
Johnstone et al (1987)
invoked massive young stars to produce the blue light and to ionize the
nebulae, even when no stellar spectral features were evident in the
blue light.
McNamara & O'Connell
(1989)
found further examples of
excess blue light from spectra and argued further for star formation.
Studies of the visual and near-infrared colors of the central galaxies
in cooling flows by
Thuan & Puschell
(1989) and
Schombert et al (1993)
show differences from normal elliptical galaxies. The first group
find a possible correlation of color and visual magnitude with M, but
no correlation of K magnitude with
. The blue colors are not
explained by a starburst with a normal initial mass function (IMF).
Romanishin (1987) showed from imaging that the blue light was more concentrated than the old starlight. In an important step, McNamara & O'connell (1993) have recently found that the excess blue light in A1795 and A2597 occurs in patches either side of the central galaxy along the radio axes (Figure 7). This is similar in appearance to many distant radio galaxies (to be discussed later) where optical polarization shows that much of the extended light is scattered. A study of the optical and IUE spectra of the excess blue light in several central galaxies (Crawford & Fabian 1993b) shows that they are fitted equally well by B5 stars or a featureless quasar-like power-law spectrum. The excess blue light may therefore be the continuum from an active nucleus in the central galaxy scattered into our line of sight by dust or electrons at larger radii. Sarazin & Wise (1993) argue that beamed emission from a BL Lac nucleus in the FR I host galaxy could be responsible. (The radio sources of most host galaxies are of the Fanaroff-Riley type I, FR I, thought to be associated with BL Lac objects.)
|
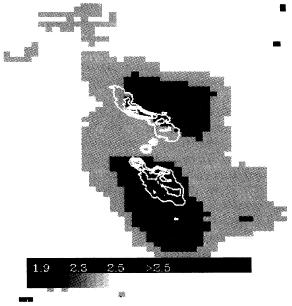
Figure 7. The excess blue light in A1795 mapped in U-I color (McNamara & O'Connell 1993) lies in 2 patches, each ~ 6 kpc, either side of the nucleus just beyond the radio lobes (white contours). The bar indicates U-I color. |
Whether the emission is due to scattered nucleus emission or star
formation, the total rate of massive star formation is low, less than
a few M
yr-1, and only detectable in the very centers of flows. The
excess blue light occurs in objects with a luminous emission-line
nebula and are thus linked in some way. They may both be indirect
products of the dense cooling environment.
The outer envelopes of central cluster galaxies show no evidence for
recent continued star formation. It is true that many such galaxies
are cD and show a halo that can extend for many 100s of kpc, but there
is no evidence that they are young (color gradients are small; see
Mackie 1992
and references therein). Nor is there evidence, apart from
the color and assumptions about the stellar IMF, that they are old. If
it is assumed that the envelope around NGC 6166 in A2199 has been
continuously formed at the present X-ray mass deposition rate, then
(depending upon shape) the upper mass limit of the IMF must lie
between 1 and 1.5
M
(Fabian et al 1991).
The optical profile and
mass-to-light ratios of central galaxies in cooling flows are
generally consistent with continued low-mass star formation
(Prestwich & Joy
1991).
If, however, we require that all the dark matter around
M87
(Stewart et al 1984a)
is low-mass stars (whether due to an early
massive cooling flow or not) then the upper mass limit must be about
0.2 M. One
possible cooling flow that appeared to have an anomalous
red envelope, GREG (Giant Red Envelope Galaxy;
Maccagni et al 1988),
has not yet been confirmed optically.
The optical continuum data show that most of the cooled gas from a flow does not form stars wqith a normal IMF Most of the gas must remain as cold clouds, or form low-mass stars or objects (see e.g. Fabian et al 1982).
Globular clusters are another possible end-point of the cooled gas
in clusters if the Jeans mass can be made appropriate to > 104 K
(Fabian et al 1984b,
Fall & Rees 1985).
They do appear to be abundant around some central cluster galaxies
(McLaughlin et al 1993
and references therein). The correlation is however more with B-M type
than with ; the specific
frequency of globular clusters is highest
where the magnitude difference between the first and second-ranked
galaxy is small (B-M II or III). The most massive flows tend to be in
B-M I or I-II clusters where the first ranked galaxy is more
luminous. If cooling flows are involved, they must occur at an earlier
stage in the formation of the central galaxies and/or clusters. Young
globular clusters have been found around the center of NGC 1275 with
the HST
(Holtzmann et al
1992).
These clusters have a range of colors
and thus ages and can be explained in that case as due to the cooling flow
(Richer et al
1993, see also
Norgaard-Nielsen et
al 1994).
Clear evidence for the gas cooling below 106 K would be an important
step in mapping the distribution of
(r), since the cooling time is
then  107
yr. Optical coronal lines such as FeX and FeXIV are good
candidates to search for but the expected fluxes are very weak
(Sarazin & Graney
1991).
Anton et al (1991)
have reported detection of
weak coronal emission from [FeX]6374 Å in the center of A1795, which is
nevertheless much stronger than expected from the X-ray inferred,
radius-dependent, . This
detection has not been confirmed by
Donahue & Stocke
(1994),
although they do claim a detection of [FeX] emission
in PKS0745-191 with upper limits on three other clusters.
Shields & Filippenko
(1992)
have conducted a deep search for FeX line emission
in the Perseus cluster and obtained an upper limit that
does not rule
out cooling flows. Confirmation (or refutation) of cooling flows using
optical coronal lines is a difficult task. Note that it is likely that
the mechanisms that generate the optical nebulosities also create some
gas at 105-106 K (e.g. mixing layers).
107
yr. Optical coronal lines such as FeX and FeXIV are good
candidates to search for but the expected fluxes are very weak
(Sarazin & Graney
1991).
Anton et al (1991)
have reported detection of
weak coronal emission from [FeX]6374 Å in the center of A1795, which is
nevertheless much stronger than expected from the X-ray inferred,
radius-dependent, . This
detection has not been confirmed by
Donahue & Stocke
(1994),
although they do claim a detection of [FeX] emission
in PKS0745-191 with upper limits on three other clusters.
Shields & Filippenko
(1992)
have conducted a deep search for FeX line emission
in the Perseus cluster and obtained an upper limit that
does not rule
out cooling flows. Confirmation (or refutation) of cooling flows using
optical coronal lines is a difficult task. Note that it is likely that
the mechanisms that generate the optical nebulosities also create some
gas at 105-106 K (e.g. mixing layers).
Optical absorption lines could give strong clues to the nature of the cooled gas. Little evidence has so far been obtained, although Carter & Jenkins (1992) have found narrow CaII and NaD lines in the spectrum of the nucleus of M87.
Some metal absorption lines in the spectra of quasars might be due to distributed cooled gas in clusters and groups along the line of sight (Crawford et al 1987). The discovery of a background quasar in the line of sight to a cooling flow would be important in this regard. Abraham et al (1993) argue that this is indeed the case for the strong foreground absorption in the spectrum of the BL Lac object AO0235+164.
The Thomson depth through a cooling flow, which measures the probability that photons are scattered by free electrons, is at least 1% in to a radius of 1 kpc in strong flows (Fabian 1989, White et al 1994). Wise & Sarazin (1990, 1992) have shown how detection of scattered (polarized) emission would be a helpful probe of the structure of the flow.