Copyright © 1982 by Annual Reviews. All rights reserved
| Annu. Rev. Astron. Astrophys. 1982. 20:
547-85 Copyright © 1982 by Annual Reviews. All rights reserved |


3.3 Relaxed nXD Clusters
The Coma cluster is often considered a prototype and is appropriately as the standard of a regular cluster (Abell 1975). However, Coma and related systems such as Abell 2255 and Abell 2256 are a rare species of clusters. Less than 5% of the clusters in Abell's (1958) complete sample are as rich. The large number of galaxies suggests these are more massive systems than most. The properties of Coma, Abell 2255, and Abell 2256 are listed in Table 1. All are late Bautz-Morgan type, rich and centrally condensed with high velocity dispersions, high X-ray temperatures, high X-ray luminosities, and X-ray core radii of ~ 0.5 Mpc. A dynamical analysis (von Hoerner 1976, Schmidt 1980) indicates that Coma and Abell 2256 are among the most dynamically evolved (no analysis was done for Abell 2255). Further support for the clusters dynamically advanced states are their low spiral fractions (Bahcall 1977b) and high X-ray temperatures and luminosities. Gunn & Gott (1972) described Coma as dynamically quiescent and suggested that the material to form stars has been absent from the Coma galaxies (with the possible exception of the two large, central galaxies) since the cluster collapse.
Another common property of these clusters is that each contains a
radio halo of diameter  1 Mpc characterized by a steep spectrum
(Jaffe & Rudnick 1979,
Hanisch et al. 1979,
Jaffe et al. 1976,
Bridle et al. 1979).
Vestrand (1981)
emphasized that while over 100 clusters
have been observed, only 4 have been found to contain radio halos. The
fourth is Abell 2319, which may also be a member of this class based
on its large X-ray core radius, high X-ray gas temperature, and large
velocity dispersion
(White & Silk 1980,
Jones et al. 1979,
Mushotzky & Smith
1980,
Danese et al. 1980).
These clusters are good candidates
for the detection of hard X-rays due to inverse Compton scattering of
microwave background photons on the relativistic electrons in the
radio halos.
1 Mpc characterized by a steep spectrum
(Jaffe & Rudnick 1979,
Hanisch et al. 1979,
Jaffe et al. 1976,
Bridle et al. 1979).
Vestrand (1981)
emphasized that while over 100 clusters
have been observed, only 4 have been found to contain radio halos. The
fourth is Abell 2319, which may also be a member of this class based
on its large X-ray core radius, high X-ray gas temperature, and large
velocity dispersion
(White & Silk 1980,
Jones et al. 1979,
Mushotzky & Smith
1980,
Danese et al. 1980).
These clusters are good candidates
for the detection of hard X-rays due to inverse Compton scattering of
microwave background photons on the relativistic electrons in the
radio halos.
| Coma | Abell 2256 | Abell 2255 | |
| Redshift a | 0.0232 | 0.0600 | 0.0797 |
| Bautz-Morgan class b | II | III | II-III |
| Velocity dispersion a | |||
| (line-of-sight) | 905-43+49 | 1254-182+323 | 1128-173+296 |
| Richness c | 2(106) | 2(88) | 2(102) |
| Central galaxy density d | 28 | 31 | 28 |
| Spiral fraction (%) e | 13 | 24 | - |
| X-ray temperature (keV) f | 7.9 ± 0.3 | 7.0 ± 1.0 | 3.8-10 |
| X-ray luminosity (erg s-1) | |||
| from 0.5-3.0 keV within | |||
| 0.5 Mpc radius | 2.5 x 1044 | 2.6 x 1044 | 1.3 x 1044 |
 calculated calculated | 0.60 ± 0.10 | 1.4 ± 0.8 | .89-2.2 |
| fit
g
| 0.76 ± 0.10 | 0.7 ± 0.05 | 0.75 ± 0.1 |
| a Danese et al. 1980 | |||
| b Bautz & Morgan 1970 | |||
| c Abell 1958 and Bahcall 1981; numbers in parenthesis are the number of galaxies within 3 Mpc of the cluster center. | |||
| d Bahcall 1981; number of galaxies within 0.5 Mpc. | |||
| e Coma is from Bahcall 1977b, and Abell 2256 is computed from Dressler 1980b | |||
| f Coma and Abell 2256 are from Mushotzky & Smith 1980; Abell 2255 is from Einstein IPC and MPC | |||
| g Coma is from Abramopoulos et al. 1981; Abell 2256 and Abell 2255 from Einstein results | |||
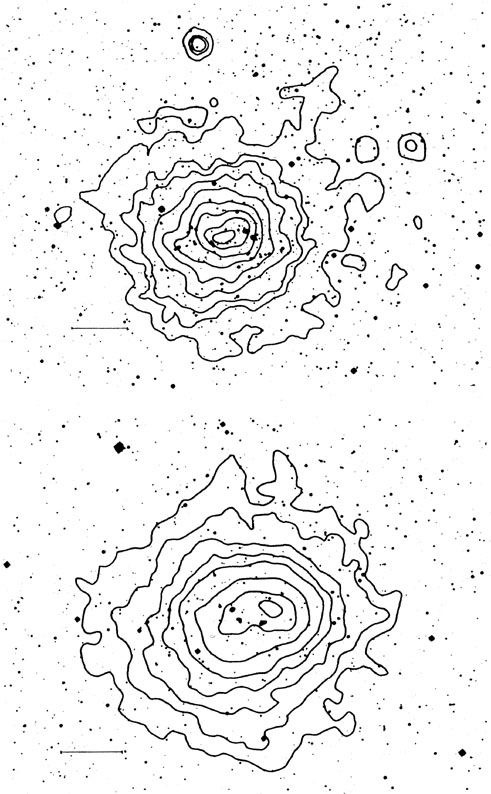
Figure 3 shows the X-ray isointensity contours
of Abell 2255 and
Abell 2256. Both show considerable symmetry with
small east-west
elongation. Neither cluster has a significant contribution from
single galaxies to its X-ray emission. Since Coma, Abell 2256, and
Abell 2255 appear relaxed with no indication of
cooling around a
central galaxy, they can be well characterized by the parameters of
the simple model described in Section 2.2.
For each cluster, the
fitted value is
less than one, implying that the gas distribution is
more extended than that of the galaxies. The values of
computed
from observed X-ray temperatures and galaxy velocity dispersions are
consistent with those measured from the surface brightness profiles
(see Table 1). However, the large uncertainties
in the cluster
velocity dispersions for Abell 2255 and Abell 2256 and the X-ray
temperature for Abell 2255 do not permit a meaningful comparison of
the calculated and
the fitted value. However, for Coma the
calculated is
better determined and agrees with the fitted value.
|
Figure 3. The X-ray isointensity contours of Abell 2255 (upper) and Abell 2256 (lower) are superposed on optical photographs. The smooth, symmetrical X-ray distribution contrasts with that of Abell 1367 (Figure 1). The bar scales for both clusters are 5' in length. The contour levels correspond to 3, 7, 9, 13, 17, 21, 25, 27, 31, sigma and 5, 7, 9, 11, 13, 17, 21, 23 sigma above background for Abell 2255 and Abell 2256 respectively. |
3.3.1 X-RAY EMISSION FROM COMA
X-ray emission from the Coma cluster was first detected by
Meekins et al. (1971),
and was shown to be extended by
Gursky et al. (1971).
The first X-ray image of the Coma cluster was obtained using rocket-borne
instrumentation
(Gorenstein et
al. 1979).
Helfand et al. (1980)
discussed Einstein IPC observations, which show the cluster emission
to be smooth with a flat central plateau and elongated at the same
position angle observed in the optical galaxy counts
(Schipper & King 1978,
Thompson & Gregory
1978).
No fluctuations on a scale of ~ 1
arcmin to a level of 1% were found in the central 40-arcmin region in
the IPC observation. Using a long HRI exposure,
Bechtold et al. (1983)
obtained 3 upper limits of
4.5-5.0 x 1042 erg s-1 for X-ray emission
from galaxies in the central 25' x 25' region of the cluster. This
strongly contrasts with Perseus, which has a substantial contribution
to the cluster luminosity from NGC 1275, and also with the cD
clusters, where the X-ray emission is peaked on the central galaxy
(see Sections 4.4 and
4.5).
upper limits of
4.5-5.0 x 1042 erg s-1 for X-ray emission
from galaxies in the central 25' x 25' region of the cluster. This
strongly contrasts with Perseus, which has a substantial contribution
to the cluster luminosity from NGC 1275, and also with the cD
clusters, where the X-ray emission is peaked on the central galaxy
(see Sections 4.4 and
4.5).
White's (1976a)
n-body simulation was quite successful in describing
the double clusters (Section 3.2), but his
original goal was to model
Coma. In his simulation, White assumed that most of
the cluster mass is concentrated in galaxies (proportional to their
luminosities). However, in his model,
White (1977)
found more mass
segregation than is observed in Coma and concluded that only a small
fraction of the cluster virial mass is associated with galaxies also
see Gunn 1977).
This agrees with the arguments of
Tanaka et al. (1981),
who used the absence of enhanced X-ray emission around the
two bright Coma ellipticals (NGC 4874 and NGC 4889) to place limits of
7 x 10¹²
M on their
masses. This implies a mass-to-light ratio less
than 50 M /
L. Since the
cluster mass-to-light ratio is substantially
larger, they also concluded that the bulk of the cluster mass is no
longer associated with the member galaxies.
on their
masses. This implies a mass-to-light ratio less
than 50 M /
L. Since the
cluster mass-to-light ratio is substantially
larger, they also concluded that the bulk of the cluster mass is no
longer associated with the member galaxies.
Abramopoulos et al. (1981) investigated the Coma cluster X-ray emission assuming an equilibrium distribution of all the elements of an isothermal plasma in a gravitational potential well. If an equilibrium distribution is valid, the heavy elements could condense toward the cluster center (Fabian & Pringle 1977). If settling has occurred, the iron-abundance determinations averaged over the entire cluster and based on the assumption of uniform abundances would be overestimates. Abramopoulos et al. found satisfactory descriptions of the Coma cluster surface brightness profile both for a gas 95% primordial and 5% enriched and for one of uniform composition (no settling) with cosmic abundances. Based on the magnetic fields inferred from the radio halo. Rephaeli (1978) argued that sedimentation of the iron nuclei would be greatly suppressed and significant abundance variations would not be expected. However, to fully answer this question, spatially resolved X-ray spectra are needed to measure any abundance gradients.